

Looking at a typical Windows system shows thousands of threads, with process numbers in the hundreds, even though the total CPU consumption is low, meaning most of these threads are doing nothing most of the time. I typically rant about it in my Windows Internals classes. Why so many threads?
Here is a snapshot of my Task Manager showing the total number of threads and processes:

Showing processes details and sorting by thread count looks something like this:

The System process clearly has many threads. These are kernel threads created by the kernel itself and by device drivers. These threads are always running in kernel mode. For this post, I’ll disregard the System process and focus on “normal” user-mode processes.
There are other kernel processes that we should ignore, such as Registry and Memory Compression. Registry has few threads, but Memory Compression has many. It’s not shown in Task Manager (by design), but is shown in other tools, such as Process Explorer. While I’m writing this post, it has 78 threads. We should probably skip that process as well as being “out of our control”.
Notice the large number of threads in processes running the images Explorer.exe, SearchIndexer.exe, Nvidia Web helper.exe, Outlook.exe, Powerpnt.exe and MsMpEng.exe. Let’s write some code to calculate the average number of threads in a process and the standard deviation:
float ComputeStdDev(std::vector<int> const& values, float& average) {
	float total = 0;
	std::for_each(values.begin(), values.end(),
		[&](int n) { total += n; });
	average = total / values.size();
	total = 0;
	std::for_each(values.begin(), values.end(),
		[&](int n) { total += (n - average) * (n - average); });
	return std::sqrt(total / values.size());
}

int main() {
	auto hSnapshot = ::CreateToolhelp32Snapshot(TH32CS_SNAPPROCESS, 0);

	PROCESSENTRY32 pe;
	pe.dwSize = sizeof(pe);

	// skip the idle process
	::Process32First(hSnapshot, &pe);

	int processes = 0, threads = 0;
	std::vector<int> threads_per_process;
	threads_per_process.reserve(500);
	while (::Process32Next(hSnapshot, &pe)) {
		processes++;
		threads += pe.cntThreads;
		threads_per_process.push_back(pe.cntThreads);
	}
	::CloseHandle(hSnapshot);

	assert(processes == threads_per_process.size());

	printf("Process: %d Threads: %d\n", processes, threads);
	float average;
	auto sd = ComputeStdDev(threads_per_process, average);
	printf("Average threads/process: %.2f\n", average);
	printf("Std. Dev.: %.2f\n", sd);

	return 0;
}
The ComputeStdDev function computes the standard deviation and average of a vector of integers. The main function uses the ToolHelp API to enumerate processes in the system, which fortunately also provides the number of threads in each processes (stored in the threads_per_process vector. If I run this (no processes removed just yet), this is what I get:
Process: 525 Threads: 7810
Average threads/process: 14.88
Std. Dev.: 23.38
Almost 15 threads per process, with little CPU consumption in my Task Manager. The standard deviation is more telling – it’s big compared to the average, which suggests that many processes are far from the average in their thread consumption. And since a negative thread count is not possible (even zero is almost impossible), the the divergence is with higher thread numbers.
To be fair, let’s remove the System and Memory Compression processes from our calculations. Here are the changes to the while loop:
while (::Process32Next(hSnapshot, &pe)) {
	if (pe.th32ProcessID == 4 || _wcsicmp(pe.szExeFile, L"memory compression") == 0)
		continue;
//...
Here are the results:
Process: 521 Threads: 7412
Average threads/process: 14.23
Std. Dev.: 14.14
The standard deviation is definitely smaller, but still pretty big (close to the average), which does not invalidate the previous point. Some processes use lots of threads.
In an ideal world, the number of threads in a system would be the same as the number of logical processors – any more and threads might fight over processors, any less and you’re not using the full power of the machine. Obviously, each “normal” process must have at least one thread running whatever main function is available in the executable, so on my system 521 threads would be the minimum number of threads. Still – we have over 7000.
What are these threads doing, anyway? Let’s examine some processes. First, an Explorer.exe process. Here is the Threads tab shown in Process Explorer:
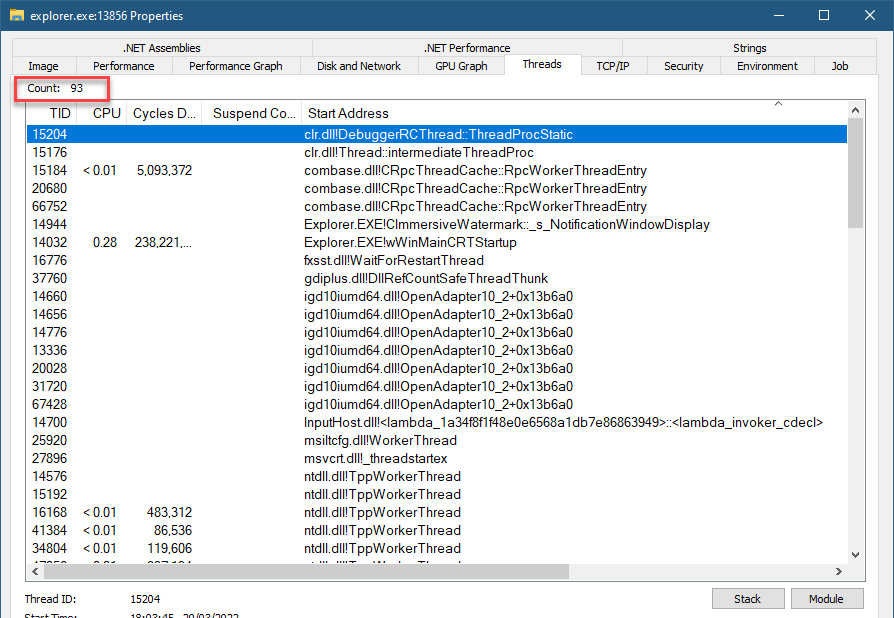
93 threads. I’ve sorted the list by Start Address to get a sense of the common functions used. Let’s dig into some of them. One of the most common (in other processes as well) is ntdll!TppWorkerThread – this is a thread pool thread, likely waiting for work. Clicking the Stack button (or double clicking the entry in the list) shows the following call stack:
ntoskrnl.exe!KiSwapContext+0x76
ntoskrnl.exe!KiSwapThread+0x500
ntoskrnl.exe!KiCommitThreadWait+0x14f
ntoskrnl.exe!KeWaitForSingleObject+0x233
ntoskrnl.exe!KiSchedulerApc+0x3bd
ntoskrnl.exe!KiDeliverApc+0x2e9
ntoskrnl.exe!KiSwapThread+0x827
ntoskrnl.exe!KiCommitThreadWait+0x14f
ntoskrnl.exe!KeRemoveQueueEx+0x263
ntoskrnl.exe!IoRemoveIoCompletion+0x98
ntoskrnl.exe!NtWaitForWorkViaWorkerFactory+0x38e
ntoskrnl.exe!KiSystemServiceCopyEnd+0x25
ntdll.dll!ZwWaitForWorkViaWorkerFactory+0x14
ntdll.dll!TppWorkerThread+0x2f7
KERNEL32.DLL!BaseThreadInitThunk+0x14
ntdll.dll!RtlUserThreadStart+0x21
The system call NtWaitForWorkViaWorkerFactory is the one waiting for work (the name Worker Factory is the internal name of the thread pool type in the kernel, officially called TpWorkerFactory). The number of such threads is typically dynamic, growing and shrinking based on the amount of work provided to the thread pool(s). The minimum and maximum threads can be tweaked by APIs, but most processes are unlikely to do so.
Another function that appears a lot in the list is shcore.dll!_WrapperThreadProc. It looks like some generic function used by Explorer for its own threads. We can examine some call stacks to get a sense of what’s going on. Here is one:
ntoskrnl.exe!KiSwapContext+0x76
ntoskrnl.exe!KiSwapThread+0x500
ntoskrnl.exe!KiCommitThreadWait+0x14f
ntoskrnl.exe!KeWaitForSingleObject+0x233
ntoskrnl.exe!KiSchedulerApc+0x3bd
ntoskrnl.exe!KiDeliverApc+0x2e9
ntoskrnl.exe!KiSwapThread+0x827
ntoskrnl.exe!KiCommitThreadWait+0x14f
ntoskrnl.exe!KeWaitForSingleObject+0x233
ntoskrnl.exe!KeWaitForMultipleObjects+0x45b
win32kfull.sys!xxxRealSleepThread+0x362
win32kfull.sys!xxxSleepThread2+0xb5
win32kfull.sys!xxxRealInternalGetMessage+0xcfd
win32kfull.sys!NtUserGetMessage+0x92
win32k.sys!NtUserGetMessage+0x16
ntoskrnl.exe!KiSystemServiceCopyEnd+0x25
win32u.dll!NtUserGetMessage+0x14
USER32.dll!GetMessageW+0x2e
SHELL32.dll!_LocalServerThread+0x66
shcore.dll!_WrapperThreadProc+0xe9
KERNEL32.DLL!BaseThreadInitThunk+0x14
ntdll.dll!RtlUserThreadStart+0x21
This one seems to be waiting for UI messages, probably managing some user interface (GetMessage). We can verify with other tools. Here is my own WinSpy:

Apparently, I was wrong. This thread has the hidden window type used to receive messages targeting COM objects that leave in this Single Threaded Apartment (STA).
We can inspect WinSpy some more to see the threads and windows created by Explorer. I’ll leave that to the interested reader.
Other generic call stacks start with ucrtbase.dll!thread_start+0x42. Many of them have the following call stack (kernel part trimmed for brevity):
ntdll.dll!ZwWaitForMultipleObjects+0x14
KERNELBASE.dll!WaitForMultipleObjectsEx+0xf0
KERNELBASE.dll!WaitForMultipleObjects+0xe
cdp.dll!shared::CallbackNotifierListener::ListenerInternal::StartInternal+0x9f
cdp.dll!std::thread::_Invoke<std::tuple<<lambda_10793e1829a048bb2f8cc95974633b56> >,0>+0x2f
ucrtbase.dll!thread_start<unsigned int (__cdecl*)(void *),1>+0x42
KERNEL32.DLL!BaseThreadInitThunk+0x14
ntdll.dll!RtlUserThreadStart+0x21
A function in CDP.dll is waiting for something (WaitForMultipleObjects). I count at least 12 threads doing just that. Perhaps all these waits could be consolidated to a smaller number of threads?
Let’s tackle a different process. Here is an instance of Teams.exe. My teams is minimized to the tray and I have not interacted with it for a while:
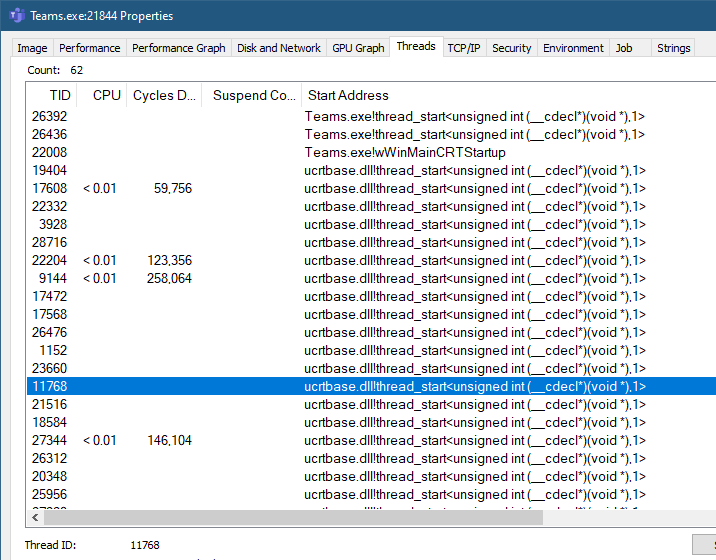
62 threads. Many have the same CRT wrapper for a thread created by Teams. Here are several call stacks I observed:
ntdll.dll!ZwRemoveIoCompletion+0x14
KERNELBASE.dll!GetQueuedCompletionStatus+0x4f
skypert.dll!rtnet::internal::SingleThreadIOCP::iocpLoop+0x116
skypert.dll!SplOpaqueUpperLayerThread::run+0x84
skypert.dll!auf::priv::MRMWTransport::process1+0x6c
skypert.dll!auf::ThreadPoolExecutorImp::workLoop+0x160
skypert.dll!auf::tpImpThreadTrampoline+0x47
skypert.dll!spl::threadWinDispatch+0x19
skypert.dll!spl::threadWinEntry+0x17b
ucrtbase.dll!thread_start<unsigned int (__cdecl*)(void *),1>+0x42
KERNEL32.DLL!BaseThreadInitThunk+0x14
ntdll.dll!RtlUserThreadStart+0x21
ntdll.dll!ZwWaitForAlertByThreadId+0x14
ntdll.dll!RtlSleepConditionVariableCS+0x105
KERNELBASE.dll!SleepConditionVariableCS+0x29
Teams.exe!uv_cond_wait+0x10
Teams.exe!worker+0x8d
Teams.exe!uv__thread_start+0xa2
Teams.exe!thread_start<unsigned int (__cdecl*)(void *),1>+0x50
KERNEL32.DLL!BaseThreadInitThunk+0x14
ntdll.dll!RtlUserThreadStart+0x21
You can check more threads, but you get the idea. Most threads are waiting for something – this is not the ideal activity for a thread. A thread should run (useful) code.
Last example, Word:

57 threads. Word has been minimized for more than an hour now. The clearly common call stack looks like this:
ntdll.dll!ZwWaitForAlertByThreadId+0x14
ntdll.dll!RtlSleepConditionVariableSRW+0x131
KERNELBASE.dll!SleepConditionVariableSRW+0x29
v8jsi.dll!CrashForExceptionInNonABICompliantCodeRange+0x4092f6
v8jsi.dll!CrashForExceptionInNonABICompliantCodeRange+0x11ff2
v8jsi.dll!v8_inspector::V8StackTrace::topScriptIdAsInteger+0x43ad0
ucrtbase.dll!thread_start<unsigned int (__cdecl*)(void *),1>+0x42
KERNEL32.DLL!BaseThreadInitThunk+0x14
ntdll.dll!RtlUserThreadStart+0x21
v8jsi.dll is the React Native v8 engine – it’s creating many threads, most of which are doing nothing. I found it in Outlook and PowerPoint as well.
Many applications today depend on various libraries and frameworks, some of which don’t seem to care too much about using threads economically – examples include Node.js, the Electron framework, even Java and .NET. Threads are not free – there is the ETHREAD and related data structures in the kernel, stack in kernel space, and stack in user space. Context switches and code run by the kernel scheduler when threads change states from Running to Waiting, and from Waiting to Ready are not free, either.
Many desktop/laptop systems today are very powerful and it might seem everything is fine. I don’t think so. Developers use so many layers of abstraction these days, that we sometimes forget there are actual processors that execute the code, and need to use memory and other resources. None of that is free.

