

Here is a simple experiment to try: open Visual Studio and create a C++ console application. All that app is doing is display “hello world” to the console:
#include <stdio.h>

int main() {
	printf("Hello, world!\n");
	return 0;
}
Build the executable in Release build and check its size. I get 11KB (x64). Not too bad, perhaps. However, if we check the dependencies of this executable (using the dumpbin command line tool or any PE Viewer), we’ll find the following in the Import directory:

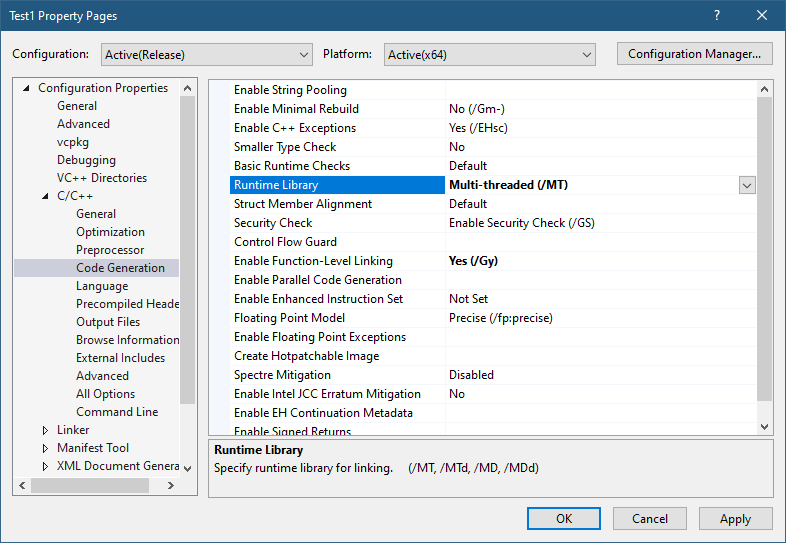
There are two dependencies: Kernel32.dll and VCRuntime140.dll. This means these DLLs will load at process start time no matter what. If any of these DLLs is not found, the process will crash. We can’t get rid of Kernel32 easily, but we may be able to link statically to the CRT. Here is the required change to VS project properties:
After building, the resulting executable jumps to 136KB in size! Remember, it’s a “hello, world” application. The Imports directory in a PE viewer now show Kernel32.dll as the only dependency.
Is that best we can do? Why do we need the CRT in the first place? One obvious reason is the usage of the printf function, which is implemented by the CRT. Maybe we can use something else without depending on the CRT. There are other reasons the CRT is needed. Here are a few:
- The CRT is the one calling our
mainfunction with the correctargcandargv. This is expected behavior by developers. - Any C++ global objects that have constructors are executed by the CRT before the
mainfunction is invoked. - Other expected behaviors are provided by the CRT, such as correct handling of the
errno(global) variable, which is not really global, but uses Thread-Local-Storage behind the scenes to make it per-thread. - The CRT implements the
newanddeleteC++ operators, without which much of the C++ standard library wouldn’t work without major customization.
Still, we may be OK doing things outside the CRT, taking care of ourselves. Let’s see if we can pull it off. Let’s tell the linker that we’re not interested in the CRT:
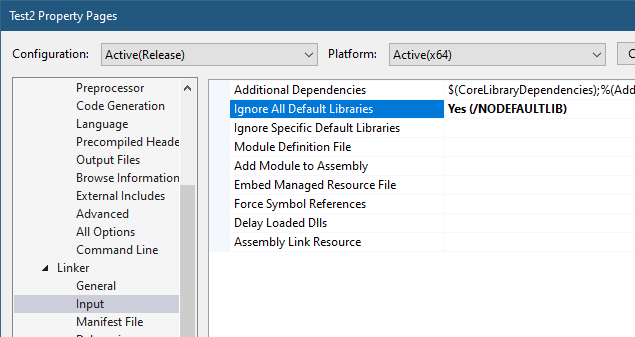
Setting “Ignore All Default Libraries” tells the linker we’re not interested in linking with the CRT in any way. Building the app now gives some linker errors:
1>Test2.obj : error LNK2001: unresolved external symbol __security_check_cookie
1>Test2.obj : error LNK2001: unresolved external symbol __imp___acrt_iob_func
1>Test2.obj : error LNK2001: unresolved external symbol __imp___stdio_common_vfprintf
1>LINK : error LNK2001: unresolved external symbol mainCRTStartup
1>D:\Dev\Minimal\x64\Release\Test2.exe : fatal error LNK1120: 4 unresolved externals
One thing we expected is the missing printf implementation. What about the other errors? We have the missing “security cookie” implementation, which is a feature of the CRT to try to detect stack overrun by placing a “cookie” – some number – before making certain function calls and making sure that cookie is still there after returning. We’ll have to settle without this feature. The main missing piece is mainCRTStartup, which is the default entry point that the linker is expecting. We can change the name, or overwrite main to have that name.
First, let’s try to fix the linker errors before reimplementing the printf functionality. We’ll remove the printf call and rebuild. Things are improving:
>Test2.obj : error LNK2001: unresolved external symbol __security_check_cookie
1>LINK : error LNK2001: unresolved external symbol mainCRTStartup
1>D:\Dev\Minimal\x64\Release\Test2.exe : fatal error LNK1120: 2 unresolved externals
The “security cookie” feature can be removed with another compiler option:
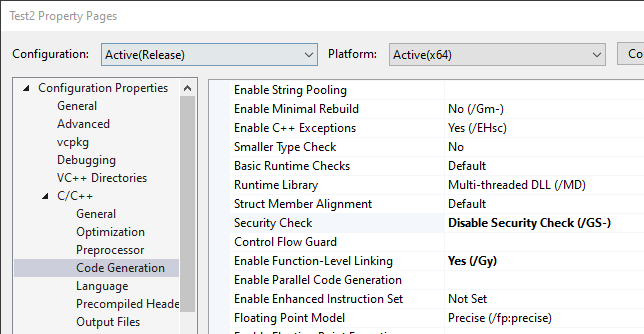
When rebuilding, we get a warning about the “/sdl” (Security Developer Lifecycle) option conflicting with removing the security cookie, which we can remove as well. Regardless, the final linker error remains – mainCRTStartup.
We can rename main to mainCRTStartup and “implement” printf by going straight to the console API (part of Kernel32.Dll):
#include <Windows.h>

int mainCRTStartup() {
	char text[] = "Hello, World!\n";
	::WriteConsoleA(::GetStdHandle(STD_OUTPUT_HANDLE),
		text, (DWORD)strlen(text), nullptr, nullptr);

	return 0;
}
This compiles and links ok, and we get the expected output. The file size is only 4KB! An improvement even over the initial project. The dependencies are still just Kernel32.DLL, with the only two functions used:

You may be thinking that although we replaced printf, that’s wasn’t the full power of printf – it supports various format specifiers, etc., which are going to be difficult to reimplement. Is this just a futile exercise?
Not necessarily. Remember that every user mode process always links with NTDLL.dll, which means the API in NtDll is always available. As it turns out, a lot of functionality that is implemented by the CRT is also implemented in NTDLL. printf is not there, but the next best thing is – sprintf and the other similar formatting functions. They would fill a buffer with the result, and then we could call WriteConsole to spit it to the console. Problem solved!
Removing the CRT
Well, almost. Let’s add a definition for sprintf_s (we’ll be nice and go with the “safe” version), and then use it:
#include <Windows.h>

extern "C" int __cdecl sprintf_s(
	char* buffer,
	size_t sizeOfBuffer,
	const char* format,	...);

int mainCRTStartup() {
	char text[64];
	sprintf_s(text, _countof(text), "Hello, world from process %u\n", ::GetCurrentProcessId());
	::WriteConsoleA(::GetStdHandle(STD_OUTPUT_HANDLE),
		text, (DWORD)strlen(text), nullptr, nullptr);

	return 0;
}
Unfortunately, this does not link: sprintf_s is an unresolved external, just like strlen. It makes sense, since the linker does not know where to look for it. Let’s help out by adding the import library for NtDll:
#pragma comment(lib, "ntdll")
This should work, but one error persists – sprintf_s; strlen however, is resolved. The reason is that the import library for NtDll provided by Microsoft does not have an import entry for sprintf_s and other CRT-like functions. Why? No good reason I can think of. What can we do? One option is to create an NtDll.lib import library of our own and use it. In fact, some people have already done that. One such file can be found as part of my NativeApps repository (it’s called NtDll64.lib, as the name does not really matter). The other option is to link dynamically. Let’s do that:
int __cdecl sprintf_s_f(
	char* buffer, size_t sizeOfBuffer, const char* format, ...);

int mainCRTStartup() {
	auto sprintf_s = (decltype(sprintf_s_f)*)::GetProcAddress(
        ::GetModuleHandle(L"ntdll"), "sprintf_s");
	if (sprintf_s) {
		char text[64];
		sprintf_s(text, _countof(text), "Hello, world from process %u\n", ::GetCurrentProcessId());
		::WriteConsoleA(::GetStdHandle(STD_OUTPUT_HANDLE),
			text, (DWORD)strlen(text), nullptr, nullptr);
	}

	return 0;
}
Now it works and runs as expected.
You may be wondering why does NTDLL implement the CRT-like functions in the first place? The CRT exists, after all, and can be normally used. “Normally” is the operative word here. Native applications, those that can only depend on NTDLL cannot use the CRT. And this is why these functions are implemented as part of NTDLL – to make it easier to build native applications. Normally, native applications are built by Microsoft only. Examples include Smss.exe (the session manager), CSrss.exe (the Windows subsystem process), and UserInit.exe (normally executed by WinLogon.exe on a successful login).
One thing that may be missing in our “main” function are command line arguments. Can we just add the classic argc and argv and go about our business? Let’s try:
int mainCRTStartup(int argc, const char* argv[]) {
//...
char text[64];
sprintf_s(text, _countof(text),
    "argc: %d argv[0]: 0x%p\n", argc, argv[0]);
::WriteConsoleA(::GetStdHandle(STD_OUTPUT_HANDLE),
	text, (DWORD)strlen(text), nullptr, nullptr);
Seems simple enough. argv[0] should be the address of the executable path itself. The code carefully displays the address only, not trying to dereference it as a string. The result, however, is perplexing:
argc: -359940096 argv[0]: 0x74894808245C8948
This seems completely wrong. The reason we see these weird values (if you try it, you’ll get different values. In fact, you may get different values in every run!) is that the expected parameters by a true entry point of an executable is not based on argc and argv – this is part of the CRT magic. We don’t have a CRT anymore. There is in fact just one argument, and it’s the Process Environment Block (PEB). We can add some code to show some of what is in there (non-relevant code omitted):
#include <Windows.h>
#include <winternl.h>
//...
int mainCRTStartup(PPEB peb) {
	char text[256];
	sprintf_s(text, _countof(text), "PEB: 0x%p\n", peb);
	::WriteConsoleA(::GetStdHandle(STD_OUTPUT_HANDLE),
		text, (DWORD)strlen(text), nullptr, nullptr);

	sprintf_s(text, _countof(text), "Executable: %wZ\n",
        peb->ProcessParameters->ImagePathName);
	::WriteConsoleA(::GetStdHandle(STD_OUTPUT_HANDLE),
		text, (DWORD)strlen(text), nullptr, nullptr);

	sprintf_s(text, _countof(text), "Commandline: %wZ\n",
        peb->ProcessParameters->CommandLine);
	::WriteConsoleA(::GetStdHandle(STD_OUTPUT_HANDLE),
		text, (DWORD)strlen(text), nullptr, nullptr);
<Winternl.h> contains some NTDLL definitions, such as a partially defined PEB. In it, there is a ProcessParameters member that holds the image path and the full command line. Here is the result on my console:
PEB: 0x000000EAC01DB000
Executable: D:\Dev\Minimal\x64\Release\Test3.exe
Commandline: "D:\Dev\Minimal\x64\Release\Test3.exe"
The PEB is the argument provided by the OS to the entry point, whatever its name is. This is exactly what native applications get as well. By the way, we could have used GetCommandLine from Kernel32.dll to get the command line if we didn’t add the PEB argument. But for native applications (that can only depend on NTDLL), GetCommandLine is not an option.
Going Native
How far are we from a true native application? What would be the motivation for such an application anyway, besides small file size and reduced dependencies? Let’s start with the first question.
To make our executable truly native, we have to do two things. The first is to change the subsystem of the executable (stored in the PE header) to Native. VS provides this option via a linker setting:

The second thing is to remove the dependency on Kernel32.Dll. No more WriteConsole and no GetCurrentProcessId. We will have to find some equivalent in NTDLL, or write our own implementation leveraging what NtDll has to offer. This is obviously not easy, given that most of NTDLL is undocumented, but most function prototypes are available as part of the Process Hacker/phnt project.
For the second question – why bother? Well, one reason is that native applications can be configured to run very early in Windows boot – these in fact run by Smss.exe itself when it’s the only existing user-mode process at that time. Such applications (like autochk.exe, a native chkdsk.exe) must be native – they cannot depend on the CRT or even on kernel32.dll, since the Windows Subsystem Process (csrss.exe) has not been launched yet.
For more information on Native Applications, you can view my talk on the subject.
I may write a blog post on native application to give more details. The examples shown here can be found here.
Happy minimization!


