Structured Storage is a Windows technology that abstracts the notions of files and directories behind COM interfaces – mainly IStorageand IStream. Its primary intent is to provide a way to have a file system hierarchy within a single physical file.
Structured Storage has been around for many years, where its most famous usage was in Microsoft Office files (*.doc, *.ppt, *.xls, etc.) – before Office moved to the extended file formats (*.docx, *.pptx, etc.). Of course, the old formats are still very much supported.
The Structured Storage interfaces (IStorage representing a directory, and IStream representing a file) are just that – interfaces. To actually use them, some implementation must be available. Windows provided an implementation of Structured Storage called Compound Files. These terms are sometime used interchangeably, but the distinction is important: Compound Files is just one implementation of Structured Storage – there could be others. Compound Files does not implement everything that could be implemented based on the defined Structured Storage interfaces, but it implements a lot, definitely enough to make it useful.
You can download an old tool (but still works well) called SSView, which can be used to graphically view the contents of physical files that were created by using the Compound File implementation. Here is a screenshot of SSView, looking at some DOC file:
Here is a more interesting example – information persisted using Sysinternals Autoruns tool (discussed later):
A more interesting hierarchy is clearly visible – although it’s all in a single file!
The Main Interfaces
The IStorage interface represents a “directory”, that can contain other directories and “files”, represented as IStream interface implementations. To get started a physical file can be created with StgCreateStorageExor an existing file opened with StgOpenStorageEx. Both return an IStorage pointer on success. From there, methods on IStorage can be called to create or open other directories (storages) and/or files (streams).
The most useful methods on IStorage are CreateStorage, CreateStream, OpenStorage and OpenStream. Enumeration of storages/streams is possible with EnumElements. Here is an example for opening a compound file for read access (filename is from a command line argument):
CComPtr<IStorage> spStg;
auto hr = ::StgOpenStorageEx(argv[1], STGM_READ | STGM_SHARE_EXCLUSIVE,
	STGFMT_STORAGE, 0, nullptr, nullptr, __uuidof(IStorage), reinterpret_cast<void**>(&spStg));
if (FAILED(hr)) {
	printf("Failed to open file (0x%X)\n", hr);
	return hr;
}
The following demonstrates enumerating the hierarchy of a given storage, recursively:
Each item has a name, but streams (“files”) can have data. The cbSize member of STATSTG returns that size. A stream is just an abstraction over a bunch of bytes. To actually read/write from/to a stream, it needs to be opened with IStorage::OpenStream before accessing the data with IStream::Read, IStream::Write and similar methods.
More on Streams
The IStream interface is used in various places within the Windows API, not just part of Structured Storage. It represents an abstraction over a buffer, that in theory could be anywhere – that’s the nice thing about an abstraction. Given an IStream pointer, you can read, wrote, seek, copy to another stream, clone, and even commit/revert a transaction, if supported by the implementation. Compound Files, by the way, doesn’t support transactions on streams.
Outside of Structured Storage, streams can be obtained in several ways.
The CreateStreamOnHGlobal API creates a memory buffer over an optional HGLOBAL (can be NULL to allocate a new one) and returns an IStream pointer to that memory buffer. This is useful when dealing with the clipboard for example, as it requires an HGLOBAL, which may not be convenient to work with. By getting an IStream pointer, the code can work with it (maybe reading it from another stream, or manually populating it with data), and then calling GetHGlobalFromStream to get the underlying HGLOBAL before passing it to the clipboard (e.g. SetClipboardData).
A stream can also be obtained for a file directly by calling SHCreateStreamOnFile, providing a convenient access to file data, abstracted as IStream.
Another case where IStream makes an appearance is in ActiveX controls persistence.
Yet another example of using IStream is as a way to “package” information for COM object’s state that would allow creating a proxy to that object from a different apartment by calling CoMarshalInterThreadInterfaceInStream(probably the longest-name COM API), that captures the state required (as an IStream) to pass to another apartment, where the corresponding CoGetInterfaceAndReleaseStreamcan be called to generate a proxy to the original object, if needed.
Case Study: Autoruns
Back in 2021 when I was working for the Sysinternals team, one of my tasks was to modernize Autoruns from a GUI perspective. I thought I would take this opportunity to do a significant rewrite, so that it would be easier to maintain the tool and improve it as needed. Fortunately, Mark Russinovich was onboard with that, although my time estimate for this project was way off 🙂 But I digress.
One of the features of Autoruns is the ability to save the information provided by the tool so it can be loaded later, possibly on a different machine. This is non-trivial, as some of the information is not easy to persist, such as icons. I don’t recall if the old Autoruns persisted them, but I definitely wanted to do so.
The old Autoruns format was sequential in nature, storing structures of data linearly in the file. Any new properties that needed to be added would require offset changes, which forced changing the format “version” and make the correct decisions when reading a file in an various “old” formats.
I wanted to make persistence more flexible, so I decided to change the format completely to be a compound file. With this scheme, adding new properties would not cause any issues – a new stream may be added, but other streams are not disturbed. The code could just ignore properties (could be storages and/or streams) it wasn’t aware of. This made the format extensible by definition, immune to any offset changes, and very easy to view using tools, like SSView. The above screenshot is from an Autoruns-persisted file.
Persisting icons, by the way, becomes pretty easy, because ImageList objects, used by Autoruns to hold collection of icons can be persisted to a stream with a single function call: ImageList_Write; very convenient!
Conclusion
The Structured Storage idea is a powerful one, and the Compound File implementation provided by Windows is pretty good and flexible. One of the reasons Microsoft moved Office to a new format was the need to make files smaller, so the new extended formats are ZIP compressed. Their internal format changed as well, and is not using Compound Files for the most part. A Structured Storage file could be compressed, saving disk space, while still maintaining convenient access using storages and streams.
In Part 1 we’ve seen how to create a new kernel object type. The natural next step is to implement some functionality associated with the new object type. Before we dive into that, let’s take a broader view of what we’re trying to do. For comparison purposes, we can take an existing kernel object type, such as a Semaphore or a Section, or any other object type, look at how it’s “invoked” to get an idea of what we need to do.
A word of warning: this is a code-heavy post, and assumes the reader is fairly familiar with Win32 and native API conventions, and has basic understanding of device driver writing.
The following diagram shows the call flow when creating a semaphore from user mode starting with the CreateSemaphore(Ex) API:
A process calls the officially documented CreateSemaphore, implemented in kernel32.dll. This calls the native (undocumented) API NtCreateSemaphore, converting arguments as needed from Win32 conventions to native conventions. NtCreateSemaphore has no “real” implementation in user mode, as the kernel is the only one which can create a semaphore (or any other kernel object for that matter). NtDll has code to transition the CPU to kernel mode by using the syscall machine instruction on x64. Before issuing a syscall, the code places a number into the EAX CPU register. This number – system service index, indicates what operation is being requested.
On the kernel side of things, the System Service Dispatcher uses the value in EAX as an index into the System Service Descriptor Table (SSDT) to locate the actual function to call, pointing to the real NtCreateSemaphore implementation. Semaphores are relatively simple objects, so creation is a matter of allocating memory for a KSEMAPHORE structure (and a header), done with OnCreateObject, initializing the structure, and then inserting the object into the system (ObInsertObject).
More complex objects are created similarly, although the actual creation code in the kernel may be more elaborate. Here is a similar diagram for creating a Section object:
As can be seen in the diagram, creating a section involves a private function (MiCreateSection), but the overall process is the same.
We’ll try to mimic creating a DataStack object in a similar way. However, extending NtDll for our purposes is not an option. Even using syscall to make the transition to the kernel is problematic for the following reasons:
There is no entry in the SSDT for something like NtCreateDataStack, and we can’t just add an entry because PatchGuard does not like when the SSDT changes.
Even if we could add an entry to the SSDT safely, the entry itself is tricky. On x64, it’s not a 64-bit address. Instead, it’s a 28-bit offset from the beginning of the SSDT (the lower 4 bits store the number of parameters passed on the stack), which means the function cannot be too far from the SSDT’s address. Our driver can be loaded to any address, so the offset to anything mapped may be too large to be stored in an SSDT entry.
We could fix that problem perhaps by adding code in spare bytes at the end of the kernel mapped PE image, and add a JMP trampoline call to our real function…
Not easy, and we still have the PatchGuard issue. Instead, we’ll go about it in a simpler way – use DeviceIoControl(or the native NtDeviceIoControlFile) to pass the parameters to our driver. The following diagram illustrates this:
We’ll keep the “Win32 API” functions and “Native APIs” implemented in the same DLL for convenience. Let’s from the top, moving from user space to kernel space. Implementing CreateDataStack involves converting Win32 style arguments to native-style arguments before calling NtCreateDataStack. Here is the beginning:
Notice the similarity to functions like CreateSemaphore, CreateMutex, CreateFileMapping, etc. An optional name is accepted, as DataStack objects can be named.
Native APIs work with UNICODE_STRINGs and OBJECT_ATTRIBUTES, so we need to do some work to be able to call the native API:
If a name exists, we wrap it in a UNICODE_STRING. The security attributes are used, if provided. The most interesting part is the actual name (if provided). When calling a function like the following:
The object name is not going to be just “MySemaphore”. Instead, it’s going to be something like “\Sessions\1\BaseNamedObjects\MySemaphore”. This is because the Windows API uses “local” session-relative names by default. Our DataStack API should provide the same semantics, which means the base directory in the Object Manager’s namespace for the current session must be used. This is the job of GetUserDirectoryRoot. Here is one way to implement it:
We just need to do that once, since the resulting directory handle can be stored in a global/static variable for the lifetime of the process; we won’t even bother closing the handle. The native NtOpenDirectoryObject is used to open a handle to the correct directory and return it. Notice that for session 0, there is a special rule: its directory is simply “\BaseNamedObjects”.
There is a snag in the above handling, as it’s incomplete. UWP processes have their own object directory based on their AppContainer SID, which looks like “\Sessions\1\AppContainerNamedObjects\{AppContainerSid}”, which the code above is not dealing with. I’ll leave that as an exercise for the interested coder.
Back in CreateDataStack – the session-relative directory handle is stored in the OBJECT_ATTRIBUTESRootDirectory member. Now we can call the native API:
HANDLE hDataStack;
auto status = NtCreateDataStack(&hDataStack, &attr, maxItemSize, maxItemCount, maxSize);
if (NT_SUCCESS(status))
	return hDataStack;

SetLastError(RtlNtStatusToDosError(status));
return nullptr;
If we get a failed status, we convert it to a Win32 error with RtlNtStatusToDosError and call SetLastErrorto make it available to the caller via the usual GetLastError. Here is the full CreateDataStack function for easier reference:
Next, we need to handle the native implementation. Since we just call our driver, we package the arguments in a helper structure and send it to the driver via NtDeviceIoControlFile:
Where is g_Device coming from? When our DataStack.Dll is loaded into a process, we can open a handle to the device exposed by the driver (which we have yet to implement). In fact, if we can’t obtain a handle, the DLL should fail to load:
OpenDevice uses the native NtOpenFileto open a handle, as the driver does not provide a symbolic link to make it slightly harder to reach it directly from user mode. If OpenDevice returns false, the DLL will unload.
Kernel Space
Now we move to the kernel side of things. Our driver must create a device object and expose IOCTLs for calls made from user mode. The additions to DriverEntry are pretty standard:
The driver creates a single device object with the name “\Device\DataStack” that was used in DllMain to open a handle to that device. IRP_MJ_CREATE and IRP_MJ_CLOSE are supported to make the driver usable. Finally, IRP_MJ_DEVICE_CONTROL handling is set up (OnDeviceControl).
The job of OnDeviceControl is to propagate the data provided by helper structures to the real implementation of the native APIs. Here is the code that covers IOCTL_DATASTACK_CREATE:
NTSTATUS OnDeviceControl(PDEVICE_OBJECT, PIRP Irp) {
	auto stack = IoGetCurrentIrpStackLocation(Irp);
	auto& dic = stack->Parameters.DeviceIoControl;
	auto len = 0U;
	auto status = STATUS_INVALID_DEVICE_REQUEST;

	switch (dic.IoControlCode) {
		case IOCTL_DATASTACK_CREATE:
		{
			auto data = (DataStackCreate*)Irp->AssociatedIrp.SystemBuffer;
			if (dic.InputBufferLength < sizeof(*data)) {
				status = STATUS_BUFFER_TOO_SMALL;
				break;
			}
			HANDLE hDataStack;
			status = NtCreateDataStack(&hDataStack,
                data->ObjectAttributes,
                data->MaxItemSize,
                data->MaxItemCount,
                data->MaxSize);
			if (NT_SUCCESS(status)) {
				len = IoIs32bitProcess(Irp) ? sizeof(ULONG) : sizeof(HANDLE);
				memcpy(data, &hDataStack, len);
			}
			break;
		}
	}

	Irp->IoStatus.Status = status;
	Irp->IoStatus.Information = len;
	IoCompleteRequest(Irp, IO_NO_INCREMENT);
	return status;
}
NtCreateDataStack is called with the unpacked arguments. The only trick here is the use of IoIs32bitProcess to check if the calling process is 32-bit. If so, 4 bytes should be copied back as the handle instead of 8 bytes.
The real work of creating a DataStack object (finally), falls on NtCreateDataStack. First, we need to have a structure that manages DataStack objects. Here it is:
The details are not important now, since we’re dealing with object creation only. But we should initialize the structure properly when the object is created. The first major step is telling the kernel to create a new object of DataStack type:
NTSTATUS NTAPI NtCreateDataStack(_Out_ PHANDLE DataStackHandle,
    _In_opt_ POBJECT_ATTRIBUTES DataStackAttributes,
    _In_ ULONG MaxItemSize, _In_ ULONG MaxItemCount, ULONG_PTR MaxSize) {
	auto mode = ExGetPreviousMode();
	extern POBJECT_TYPE g_DataStackType;
	//
	// sanity check
	//
	if (g_DataStackType == nullptr)
		return STATUS_NOT_FOUND;

	DataStack* ds;
	auto status = ObCreateObject(mode, g_DataStackType, DataStackAttributes, mode,
		nullptr, sizeof(DataStack), 0, 0, (PVOID*)&ds);
	if (!NT_SUCCESS(status)) {
		KdPrint(("Error in ObCreateObject (0x%X)\n", status));
		return status;
	}
ExGetPreviousMode returns the caller’s mode (UserMode or KernelMode enum values), and based off of that we ask ObCreateObject to make the relevant probing and security checks. ObjectType is our DataStack type object, ObjectBodySize is sizeof(DataStack), our data structure. The last parameter is where the object pointer is returned.
If this succeeds, we need to initialize the structure appropriately, and then add the object to the system “officially”, where the object header would be built as well:
This is it for CreateDataStack and its chain of called functions. Handling OpenDataStack is similar, and simpler, as the heavy lifting is done by the kernel.
Opening an Existing DataStack Object
OpenDataStack attempts to open a handle to an existing DataStack object by name:
Again, from a high-level perspective it looks similar to APIs like OpenSemaphore or OpenEvent. NtOpenDataStack will make a call to the driver via NtDeviceIoControlFile, packing the arguments:
The simplicity is thanks to the generic ObOpenObjectByName kernel API, which is not documented, but is exported, that attempts to open a handle to any named object:
That’s it for creating and opening a DataStack object. Let’s test it!
Testing
After deploying the driver to a test machine, we can write simple code to create a DataStack object (named or unnamed), and see if it works. Then, we’ll close the handle:
#include <Windows.h>
#include <stdio.h>
#include "..\DataStack\DataStackAPI.h"

int main() {
	HANDLE hDataStack = CreateDataStack(nullptr, 0, 100, 10 << 20, L"MyDataStack");
	if (!hDataStack) {
		printf("Failed to create data stack (%u)\n", GetLastError());
		return 1;
	}

	printf("Handle created: 0x%p\n", hDataStack);

	auto hOpen = OpenDataStack(GENERIC_READ, FALSE, L"MyDataStack");
	if (!hOpen) {
		printf("Failed to open data stack (%u)\n", GetLastError());
		return 1;
	}

	CloseHandle(hDataStack);
	CloseHandle(hOpen);
	return 0;
}
Here is what Process Explorer shows when the handle is open, but not yet closed:
Windows provides much of its functionality via kernel objects. Common examples are processes, threads, mutexes, semaphores, sections, and many more. We can see the object types supported on a particular Windows system by using a tool such as Object Explorer, or in a more limited way – WinObj. Here is a view from Object Explorer:
Every object type has a name (e.g. “Process”), an index, the pool to use for allocating memory for these kind of objects (typically Non Paged pool or Paged pool), and a few more properties. The “dynamic” part in the above screenshot shows that an object type keeps track of the number of objects and handles currently used for that type. Object types are themselves objects, as is perhaps evident from the fact that there is an object type called “Type” (index 2, the first one), and its number of “objects” is the number of object types supported on this version of Windows.
User mode clients use kernel objects by invoking APIs. For example, CreateProcess creates a process object and a thread object, returning handles to both. OpenProcess, on the other hand, tries to obtain a handle to an existing process object, given its process ID and the access mask requested. Similar APIs exist for other object types. All this should be fairly familiar to reader of this blog.
A New Kernel Object Type
Can we create a new kernel object type, that provides some useful functionality to user-mode (and kernel-mode) clients? Perhaps we should first ask, why would we want to do that? As an alternative, we can create a kernel driver that exposes the desired functionality through I/O control codes, invoked with DeviceIoControlby clients. We can certainly create nice wrappers that provide nicer-looking functions so that clients do not need to see the DeviceIoControl calls.
I can see at two reasons to go the “new object type” approach:
It’s a great learning opportunity, and could be fun 🙂
We get lots of things for free, such as handle and objects management (handle count, ref count), sharing capabilities, just like any other kernel object, and some common APIs clients are already familiar with, like CloseHandle.
OK, let’s assume we want to go down this route. How do we create an object type, or a “generic” kernel object, for that matter. As it turns out, the kernel functions needed are exported, but they are not documented. We’ll use them anyway 😉
We’ll create an Empty WDM Driver in Visual Studio, delete the INF file so we are left with an empty project with the correct settings for the compiler and linker. For more information on creating driver projects, consult the official documentation, or my book, “Windows Kernel Programming, 2nd edition“.
We’ll add a C++ file to the project, and write our DriverEntry routine. At first, its only job is to create a new type object:
The kernel object type we’ll implement is called “DataStack”, and it’s supposed to provide a stack-like functionality. You may be wondering what’s so special about that? Every language/library under the sun has some stack data structure. Implemented as kernel objects, these data stacks offer some benefits that are normally unavailable:
Thread Synchronization, so the data stack can be accessed freely by clients. Data race prevention is the burden of the implementation.
These data stacks can be shared between processes, something not offered by any stack implementation you find in languages/libraries.
You could argue that it would be possible to implement such data stacks on top of Section (File Mapping) objects, which allow sharing of memory, with some API that does all the heavy lifting. This is true in essence, but not ideal. The section could be misused by accessing it directly without regard to the data stack implemented. And besides, it’s not the point. You could come up with another kind of object that would not lend itself to easy implementation in other ways.
Back to DriverEntry: The only call is to a helper function, whose purpose is to create the object type. Creating an object type is done with ObCreateObjectType, declared like so:
TypeName is the type name for the new type, which must be unique. ObjectTypeInitializer provides various properties for the type object, some of which we’ll examine momentarily. sd is an optional security descriptor to assign to the new type object, where NULL means the kernel will provide an appropriate default. ObjectType is the returned object type pointer, if successful. The POBJECT_TYPE is not defined in all its glory in the WDK headers, so it’s treated as a PVOID, but that’s fine. We won’t need to look inside.
The simplest way to create the type object would be like so:
UNICODE_STRING typeName = RTL_CONSTANT_STRING(L"DataStack");
OBJECT_TYPE_INITIALIZER init{ sizeof(init) };
auto status = ObCreateObjectType(&typeName, &init, nullptr,
    &g_DataStackType);
The OBJECT_TYPE_INITIALIZER has a Length first member, which must be initialized to the size of the structure, as is common in many Windows APIs. The rest of the structure is zeroed out, which is good enough for our first attempt. The returned pointer lands in a global variable (g_DataStackType), that we can use if needed.
The Unload routine may try to remove the new object type like so:
Let’s see the effect this could has when the driver is deployed and loaded. First, Here is Object Explorer on a Windows 11 VM where the driver is deployed:
Notice the new object type, with an index of 76 and the name “DataStack”. There are zero objects and zero handles for this kind of object right now (no big surprise there). Let’s see what the kernel debugger has to say:
Clearly there is such a object type, and it has 2 references, one of which we are holding in our kernel variable. We can examine the object in its more specific role as a object type:
Note the Name and the fact that there are zero objects and handles.
Let’s see what happens when we unload the driver. Since we’re dereferencing our reference (g_DataStackType), the object type is still alive, as the kernel holds to another reference (this was generated in a different run of the system, so the addresses are not the same):
We could remove the “permanent” flag from the type object by making it “temporary” (a.k.a. normal) in our Unload routine, like so:
HANDLE hType;
auto status = ObOpenObjectByPointer(g_DataStackType,
    OBJ_KERNEL_HANDLE, nullptr, 0, nullptr, KernelMode, &hType);
if (NT_SUCCESS(status)) {
    status = ZwMakeTemporaryObject(hType);
    ZwClose(hType);
}
ObDereferenceObject(g_DataStackType);
Calling ZwMakeTemporaryObject(a documented API) removes the permanent bit, so that ObDereferenceObjectremoves the last reference of the DataStack object type. Unfortunately, this works too well – it also causes the system to crash (BSOD), and that’s because the kernel does not expect type objects to be deleted. It makes sense, since objects of that type may still be alive. Even if the kernel could determine that no objects of that type are alive right now, and allow the deletion, what would that mean for future creations? Worse, it’s possible to create objects privately without a header (very common in the kernel), which means the kernel is unaware of these objects to begin with. The bottom line is, type objects cannot be destroyed safely. In our case, it means the driver should remain alive at all times, but regardless, it should not attempt to destroy the type object.
Object Type Customization
The code to create the DataStack object type did not do any customizations. Possible customizations are available via the OBJECT_TYPE_INITIALIZER structure:
This is quite a structure. The various *Procedure members are callbacks. You can find their prototypes in the ReactOS source code, but for now you can just replace all of them with an opaque PVOID to make it easier to deal with the structure. At this point, we’ll customize our object type’s creation like so:
The PoolType member indicates from which pool objects of this type should be allocated. I’ve selected the Non Paged pool with no execute allowed. DataStack is the structure we’ll use for the implementation of the type. We’ll see what that looks like in the next post. For now, we indicate to the kernel that the base memory consumption of objects of DataStack type is the size of that structure.
Next, we see some constants being used that I have defined in a file that is going to be shared between the driver and user mode clients that has some definitions, similar to other object kinds:
These #defines provide specific access mask bits for objects of the DataStack type. We’ll use these in the implementation so that only powerful-enough handles would allow the relevant access. In the object type creation we use these in the ValidAccessMask member to indicate what is valid to request by clients, and also to provide generic mapping. Generic mapping is a standard feature used by Windows to map generic rights (GENERIC_READ, GENERIC_WRITE, GENERIC_EXECUTE, and GENERIC_ALL) to specific rights appropriate for the object type. You can see these mappings in Object Explorer for all object types. For example, if a client asks for GENERIC_READ when opening a DataStack object, the access requested is going to be DATA_STACK_QUERY.
What’s Next?
We have an object type, that’s great! But we can’t create objects of this type, nor use it in any way. We’re missing the actual implementation. From a user-mode perspective, we’d like to expose an API, not much different in spirit than other object types:
if you’re familiar with the Windows Native API, the “spirit” of these DataStack API is the same. The big questions are, how do we implement these APIs – in user mode and kernel mode? We’ll look into it in the next post.
I have not provided a prebuilt project for this part. Feel free to type things yourself, as there is not too much code at this point. In the next post, I’ll provide a Github repo that has all the code. See you then!
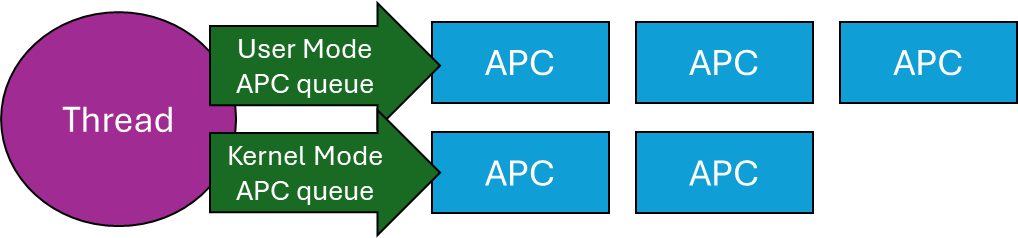
Asynchronous Procedure Calls (APCs) in Windows are objects that can be attached to threads. Every thread has its own APC queue, where an APC stores a function and arguments to call. The idea is that we’d like the a function to be executed by a specific thread, rather than some arbitrary thread. This is because the process this thread is part of is important for some reason, so the APC (when executed) has full access to that process resources.
Technically, there are user-mode, kernel-mode, and Special kernel-mode APCs, In this post I’ll discuss user mode APCs, those directly supported by the Windows API. (There is also Special user-mode APCs, but these are not generally usable). Here is a conceptual representation of a thread and its APC queues:
A Thread and its APC queues
When a user mode APC is queued to a thread (more on that later), the APC just sits there in the queue, doing nothing. To actually run the APCs currently attached to a thread, that thread must go into an alertable wait (also called alertable state). When in that state, any and all APCs in the thread’s queue execute in sequence. But how does a thread go into an alertable wait?
There are a few functions that can do that. The simplest is SleepEx, the extended Sleep function:
DWORD SleepEx(DWORD msec, BOOL alertable);
If alertable is FALSE, the function is identical to Sleep. Otherwise, the thread sleeps for the designated time (which can be zero), and if any APCs exits in its queue (or appear while it’s sleeping), will execute now, and the sleep is over, in which case the return value from SleepEx is WAIT_IO_COMPLETION rather than zero. A typical call might be SleepEx(0, TRUE) to force all queued APCs to run (if there are any). You can think of this call as a “garbage collection” of APCs. If a thread does not ever go into an alertable wait, any attached APCs will never execute.
Other ways of entering an alertable wait involve using the extended versions of the various wait functions, such as WaitForSingleObjectEx, WaitForMultipleObjectsEx, where an additional Boolean argument is accepted just like SleepEx. MsgWaitForMultipleObjectsExcan do that as well, although the alertable state is specified with a flag (MWMO_ALERTABLE) rather than a Boolean.
Now that know how user mode APCs work, we can try to put them to good use.
Asynchronous I/O Completion
The “classic” use of user mode APCs is to get notified of asynchronous I/O operations. Windows has several mechanisms for this purpose, one of which involves APCs. Specifically, the ReadFileExand WriteFileExAPIs receive an extra parameter (compared to their non-Ex variants) that is a callback to be invoked when the asynchronous I/O operation completes. The catch is, that the callback is wrapped in an APC queued to the requesting thread, which means it can only execute if/when that thread enters an alertable wait. Here is some conceptual code:
HANDLE hFile = ::CreateFile(..., FILE_FLAG_OVERLAPPED, nullptr);
OVERLAPPED ov{};
ov.Offset = ...;
::ReadFileEx(hFile, buffer, size, &ov, OnIoCompleted);
// other work...
// from time to time, execute APCs:
::SleepEx(0, TRUE);
The Completion routine has the following prototype:
In practice, this mechanism of being notified of asynchronous /O completion is not very popular, because it’s usually inconvenient to use the same thread for completion. In fact, the thread might exit before the I/O completed. Still, it’s an option that utilizes APCs.
Injecting a DLL into a Process
It’s sometimes useful to “force” somehow another process to load a DLL you provide. The classic way of achieving that is by using the CreateRemoteThreadAPI, where the “thread function” is set to the address of the LoadLibraryAPS, because a thread’s function and LoadLibrary have the same prototype from a binary perspective – both accept a pointer. LoadLibrary is passed the path of the DLL to load. You can find a video I made to show this classic technique here: https://youtu.be/0jX9UoXYLa4. A full source code example is here: https://github.com/zodiacon/youtubecode/tree/main/Injection.
The problem with this approach is that it’s pretty visible – anti-malware kernel drivers get notified when a thread is created, and if created by a thread in a different process, that may be suspicious from the driver’s perspective. By the way, the “legitimate” usage of CreateRemoteThread is for a debugger to break in forcefully to a target process in an initial attach, by forcing a new thread in the process to call DbgBreakPoint.
Using an APC, we may be able to “persuade” an existing thread to load our DLL. This is much stealthier, since it’s an existing thread loading a DLL – a very common occurrence. To achieve that, we can use the generic QueueUserAPCAPI:
Fortunately, an APC function has the same binary layout as a thread function – again receiving some kind of pointer. The main issue with this technique is that the target thread may not get into an alertable wait ever. To increase the probability of success, we can queue the APC to all threads in the target process – we just need one to enter an alertable wait. This works well for processes like Explorer, which have so many threads it practically always works. Here is a link to a video I made to show this technique: https://youtu.be/RBCR9Gvp5BM
A Natural Queue
Lastly, since APCs are stored in a queue, we can create a “work queue” very naturally just by utilizing APCs. If you need a queue of functions to be invoked sequentially, you could manage them yourself with the help of (say) std::queue<> in C++. But that queue is not thread-safe, so you would have to properly protect it. If you’re using .NET, you may use ConcurrentQueue<> to help with synchronization, but you still would need to build some kind of loop to pop items, invoke them, etc. With APCs, this all becomes natural and pretty easy:
Simplicity itself. An event object can be used to quit this infinite loop (SetEventcalled from somewhere). The thread waits for APCs to appear in its queue, and runs them when they do, returning to waiting. Clients of this queue call QueueUserAPC to enqueue work items (callbacks) to that thread. That’s it – simple and elegant.
Summary
APCs provide a way to allow callbacks to be invoked sequentially by a target thread. Maybe you can find other creative use of APCs.
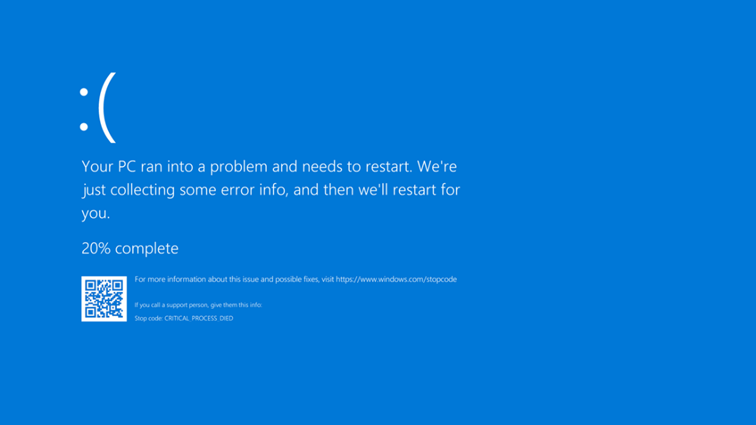
Millions of machines around the world crashed a few days ago, showing the dreaded “Blue Screen of Death” (BSOD), affecting banks, airports, hospitals, and many other businesses, all using the Windows OS and CrowdStrike’s Endpoint Detection and Response (EDR) software. What was going on? How can such a calamity happen in one single swoop?
First, foul play was suspected – a cyber security attack perhaps. But it turned out to be a bad update of CrowdStrike’s “Falcon” software agent that caused all this mess. What is a BSOD anyway?
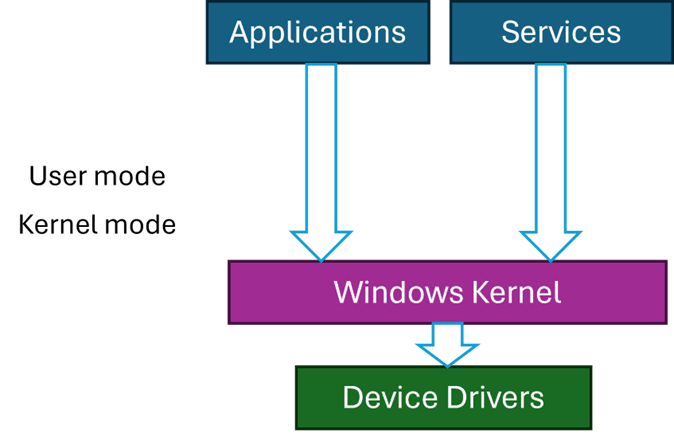
Code running on Windows can run in two primary modes – user mode and kernel mode. User mode is restricted in its access, which cannot harm the OS. This is the mode applications run with – such as Explorer, Word, Notepad, and any other application. Kernel mode, however, has (almost) unlimited power. But, as the American hero movies like to say, “With great power comes great responsibility” – and this is where things can go wrong.
Kernel code is trusted, by definition, because it can do anything. The Windows kernel is the main part of kernel space, but third-party components may be installed in the kernel, called device drivers. Classic device drivers are required to manage hardware devices – connecting them to the rest of the OS. The fact that you can move your cursor with the mouse, see something on the screen, hear game sounds, etc., means there are device drivers dealing with the hardware correctly, some of which are not written by Microsoft.
If a driver misbehaves, such as causing an exception to occur, the system crashes with the infamous BSOD. This is not some kind of punishment, but a protection mechanism. If a driver misbehaves (or any other kernel component), it is best to stop now, rather than letting the code continue execution which might cause more damage, like data corruption, and even prevent Windows from starting successfully.
Third party drivers are the only entities that Microsoft has no full control over. Drivers must be properly signed, but that only guarantees that they have not been tampered with, as it does not necessarily guarantee quality.
Most Windows systems have some Anti-virus or EDR software protecting them. By default, you get Windows Defender, but there are more powerful EDRs out there, CrowdStrike’s Falcon being one of the leaders in this space.
The “incident” involved a bad update that caused a BSOD when Windows restarted. Restarting again did not help, as a BSOD was showing immediately because of a bug in the driver when it’s loaded and initialized. The only recourse was to boot the system in Safe Mode, where only a minimal set of drivers is loaded, disable the problematic driver, and reboot again. Unfortunately, this has to be done manually on millions of machines.
The Windows kernel treats all kernel components in the same way, regardless of whether that component is from Microsoft or not. Any driver, no matter how insignificant, that causes an unhandled exception, will crash the system with a BSOD. Maybe it would be wise to somehow designate drivers as “important” or “not that important” so they may be treated differently in case of failure. But that is not how Windows works, and in any case, an anti-malware driver is likely to be tagged as “important”.
This entire incident certainly raises questions and concerns – a single point of failure has shown itself in full force. Perhaps a different approach to handling kernel components should be considered.
Personally, I was never comfortable with Windows uniform treatment of kernel components and drivers, but in practice it’s unclear what would be a good way to deal with such exceptions. One alternative is to write drivers in user mode, and many are written in this way, especially to handle relatively slow devices, like USB devices. This works well, but is not good enough for an EDR’s needs.
Perhaps specifically for anti-malware drivers, any unhandled exception should be treated differently by disabling the driver in some way. Not easy to do – the driver has typically registered with the kernel (e.g. PsSetCreateProcessNotifyRoutineExand others), its callbacks may be running right now – how would the kernel “disable” it safely. I don’t think there is a safe way to do that without significant changes in driver protocols. The best one case do (in theory) is issue a BSOD, but disable the offending driver automatically, so that the next restart will work, and a warning can be issued to the user.
This is not ideal, but is certainly better than the alternative experienced in the recent crash. Why is it not ideal? First, the system will be unprotected, unless some default (like Defender) would automatically take over. Second, it’s difficult to determine with 100% certainty that the driver causing the crash is the ultimate culprit. For example, another (buggy) driver may write to anywhere in kernel space, including memory that may belong to our anti-malware driver, and that write operation does not cause an immediate crash since the memory is valid. Later, our driver will stumble upon the bad data and crash. Even so, some kind of mechanism to prevent the widespread crash must be set in place.
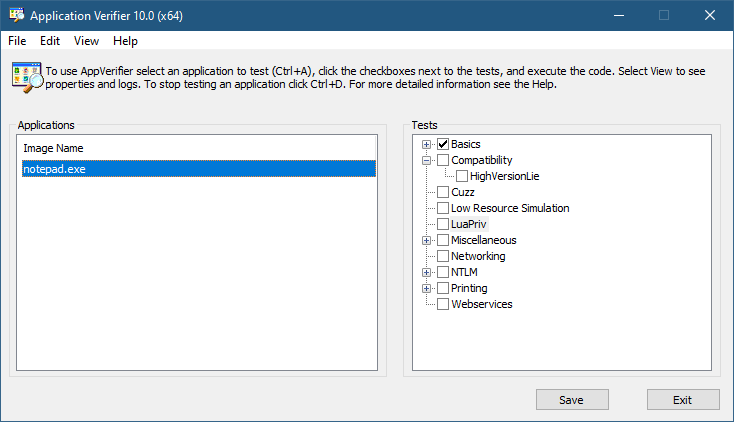
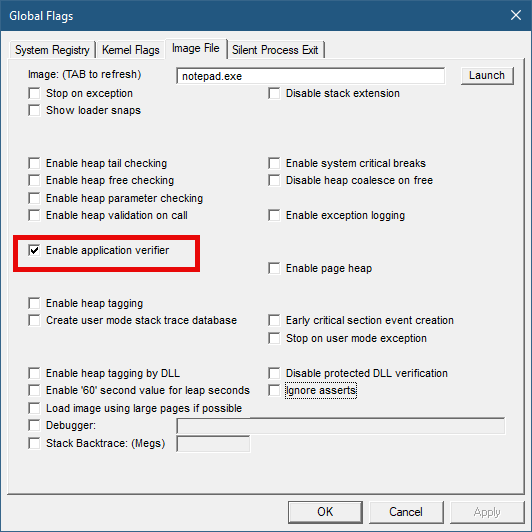
The Application Verifier tool that is part of the Windows SDK provide a way to analyze processes for various types of misbehavior. The GUI provided looks like the following:
Application Verifier application window
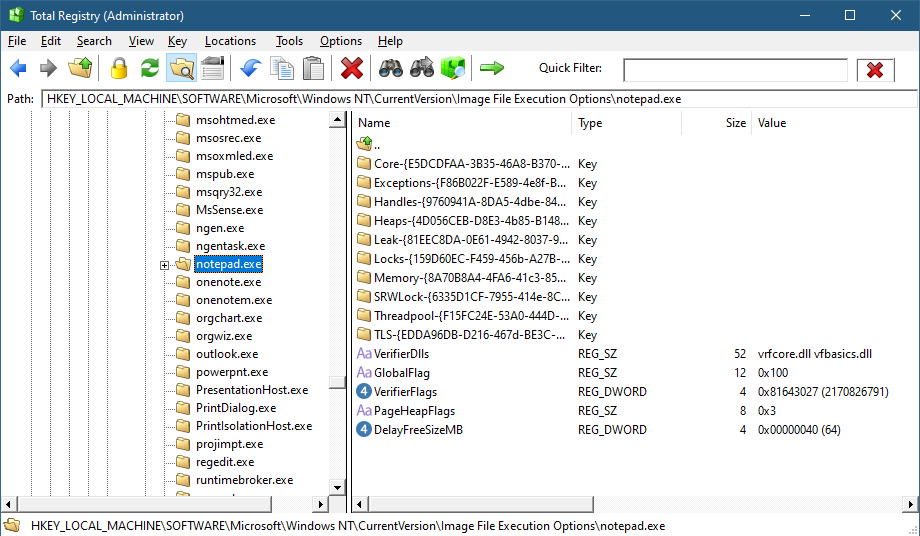
To add an application, you can browse your file system and select an executable. The Application Verifier settings are based around the executable name only – not a full path. This is because verifier settings are stored in a subkey under Image File Execution Options with the name of the executable. For the notepad example above, you’ll find the following in the Registry:
Key for notepad.exe under the IFEO subkey
This IFEO subkey is used for NT Global Flags settings, one of which is using the Application Verifier. The GlobalFlag value is shown to be 0x100, which is the bit used for the verifier. Another way to set it without any extra information is using the GFlags tool, part of the Debugging Tools for Windows package:
GFlags tool
The Application Verifier lists a bunch of DLLs under the VerifierDLLs value. Each one must be located in the system directory (e.g., c:\Windows\System32). Full paths are not supported; this is intentional, because the list of DLLs are going to be loaded to any process running the specified executable, and it would be risky to load DLLs from arbitrary locations in the file system. The system directory, as well as the IFEO key are normally write-accessible by administrators only.
The list of verifier DLLs is selected based on the set of tests selected by the user on the right hand side of the GUI. You’ll find subkeys that are used by the system-provided verifier DLLs with more settings related to the tests selected.
The nice thing about any verifier DLL specified, is that these DLLs are loaded early in the process lifetime, by verifier.dll (in itself loaded by NTDLL.dll), before any other DLLs are loaded into the process. Even attaching a debugger to the process while launching it would “miss” the loading of these DLLs.
This behavior makes this technique attractive for injecting a DLL into arbitrary processes. It’s even possible to enable Application Verifier globally and even dynamically (without the need to restart the system), so that these DLLs are injected into all processes (except protected processes).
Writing a Verifier DLL
Application Verifier tests descriptions is not the focus of this post. Rather, we’ll look into what it takes to create such a DLL that can be injected early and automatically into processes of our choice. As we’ll see, it’s not just about mere injection. The verifier infrastructure (part of verifier.dll) provides convenient facilities to hook functions.
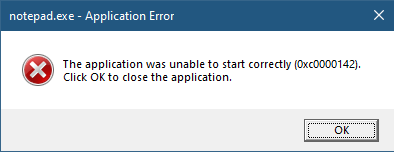
If we create a standard DLL, set up the verifier entries while adding our DLL to the list of verifier DLLs (possibly removing the “standard” ones), and try to run our target executable (say, notepad), we get the following nasty message box:
The process shuts down, which means that if a verifier DLL fails to be properly processed, the process terminates rather than “skipping” the DLL.
Launching notepad with WinDbg spits the following output:
Clearly the DLL did not initialize correctly, which is what the NTSTATUS 0xc0000142 was trying to tell us in the message box.
DLLs are initialized with the DllMain function that typically looks like this:
BOOL WINAPI DllMain(HMODULE hModule, DWORD reason, PVOID lpReserved) {
	switch (reason) {
		case DLL_PROCESS_ATTACH:
		case DLL_THREAD_ATTACH:
		case DLL_THREAD_DETACH:
		case DLL_PROCESS_DETACH:
			break;
	}
	return TRUE;
}
The classic four values shown are used by the DLL to run code when it’s loaded into a process (DLL_PROCESS_ATTACH), unloaded from a process (DLL_PROCESS_DETACH), a thread is created in the process (DLL_THREAD_ATTACH), and thread is exiting in the process (DLL_THREAD_DETACH). It turns out that there is a fifth value, which must be used with verifiier DLLs:
#define DLL_PROCESS_VERIFIER 4
Returning TRUE from such a case is not nearly enough. Instead, a structure expected by the caller of DllMain must be initialized and its address provided in lpReserved. The following structures and callback type definitions are needed:
That’s quite a list. The main structure is RTL_VERIFIER_PROVIDER_DESCRIPTOR that has a pointer to an array of RTL_VERIFIER_DLL_DESCRIPTOR (the last element in the array must end with all zeros), which in itself points to an array of RTL_VERIFIER_THUNK_DESCRIPTOR , used for specifying functions to hook. There are a few callbacks as well. At a minimum, we can define this descriptor like so (no hooking, no special code in callbacks):
This time it works. MyVerify.dll loads right after verifier.dll (which is the one managing verify DLLs).
Hooking Functions
As mentioned before, we can use the verifier engine’s support for hooking functions in arbitrary DLLs. Let’s give this a try by hooking into a couple of functions, GetMessage and CreateFile. First, we need to set up the structures for the hooks on a per-DLL basis:
The second NULL in each triplet is where the original address of the hooked function is stored by the verifier engine. Now we fill the structure with the list of DLLs, pointing to the hook arrays:
The last thing is to actually implement the hooks:
BOOL WINAPI HookGetMessage(PMSG msg, HWND hWnd, UINT filterMin, UINT filterMax) {
	// get original function
	static const auto orgGetMessage = (decltype(::GetMessageW)*)user32Hooks[0].ThunkOldAddress;
	auto result = orgGetMessage(msg, hWnd, filterMin, filterMax);
	char text[128];
	sprintf_s(text, "Received message 0x%X for hWnd 0x%p\n", msg->message, msg->hwnd);
	OutputDebugStringA(text);
	return result;
}

HANDLE WINAPI HookCreateFile(PCWSTR path, DWORD access, DWORD share, LPSECURITY_ATTRIBUTES sa, DWORD cd, DWORD flags, HANDLE hTemplate) {
	// get original function
	static const auto orgCreateFile = (decltype(::CreateFileW)*)kernelbaseHooks[0].ThunkOldAddress;
	auto hFile = orgCreateFile(path, access, share, sa, cd, flags, hTemplate);
	char text[512];
	if (hFile == INVALID_HANDLE_VALUE)
		sprintf_s(text, "Failed to open file %ws (%u)\n", path, ::GetLastError());
	else
		sprintf_s(text, "Opened file %ws successfuly (0x%p)\n", path, hFile);

	OutputDebugStringA(text);
	return hFile;
}
The hooks just send some output with OutputDebugString. Here is an excerpt output when running notepad under a debugger:
ModLoad: 00007ff7`6dfa0000 00007ff7`6dfd8000   notepad.exe
ModLoad: 00007ffd`978f0000 00007ffd`97ae8000   ntdll.dll
ModLoad: 00007ffd`1f650000 00007ffd`1f6c4000   C:\Windows\System32\verifier.dll
Page heap: pid 0xEF18: page heap enabled with flags 0x3.
AVRF: notepad.exe: pid 0xEF18: flags 0x81643027: application verifier enabled
ModLoad: 00007ffd`25b80000 00007ffd`25d24000   C:\Windows\SYSTEM32\MyVerify.dll
ModLoad: 00007ffd`97650000 00007ffd`9770d000   C:\Windows\System32\KERNEL32.dll
ModLoad: 00007ffd`951b0000 00007ffd`954a6000   C:\Windows\System32\KERNELBASE.dll
ModLoad: 00007ffd`963e0000 00007ffd`9640b000   C:\Windows\System32\GDI32.dll
ModLoad: 00007ffd`95790000 00007ffd`957b2000   C:\Windows\System32\win32u.dll
ModLoad: 00007ffd`95090000 00007ffd`951a7000   C:\Windows\System32\gdi32full.dll
...
ModLoad: 00007ffd`964f0000 00007ffd`965bd000   C:\Windows\System32\OLEAUT32.dll
ModLoad: 00007ffd`96d10000 00007ffd`96d65000   C:\Windows\System32\shlwapi.dll
ModLoad: 00007ffd`965d0000 00007ffd`966e4000   C:\Windows\System32\MSCTF.dll
Opened file C:\Windows\Fonts\staticcache.dat successfuly (0x0000000000000164)
ModLoad: 00007ffd`7eac0000 00007ffd`7eb6c000   C:\Windows\System32\TextShaping.dll
ModLoad: 00007ffc`ed750000 00007ffc`ed82e000   C:\Windows\System32\efswrt.dll
ModLoad: 00007ffd`90880000 00007ffd`909d7000   C:\Windows\SYSTEM32\wintypes.dll
ModLoad: 00007ffd`8bf90000 00007ffd`8bfad000   C:\Windows\System32\MPR.dll
ModLoad: 00007ffd`8cae0000 00007ffd`8cce3000   C:\Windows\System32\twinapi.appcore.dll
Opened file C:\Windows\Registration\R000000000025.clb successfuly (0x00000000000001C4)
ModLoad: 00007ffd`823b0000 00007ffd`82416000   C:\Windows\System32\oleacc.dll
...
Received message 0x31F for hWnd 0x00000000001F1776
Received message 0xC17C for hWnd 0x00000000001F1776
Received message 0xF for hWnd 0x00000000001F1776
Received message 0xF for hWnd 0x00000000003010C0
Received message 0xF for hWnd 0x0000000000182E7A
Received message 0x113 for hWnd 0x00000000003319A8
...
ModLoad: 00007ffd`80e20000 00007ffd`80fd4000   C:\Windows\System32\WindowsCodecs.dll
ModLoad: 00007ffd`94ee0000 00007ffd`94f04000   C:\Windows\System32\profapi.dll
Opened file C:\Users\Pavel\AppData\Local\IconCache.db successfuly (0x0000000000000724)
ModLoad: 00007ffd`3e190000 00007ffd`3e1f6000   C:\Windows\System32\thumbcache.dll
Opened file C:\Users\Pavel\AppData\Local\Microsoft\Windows\Explorer\iconcache_idx.db successfuly (0x0000000000000450)
Opened file C:\Users\Pavel\AppData\Local\Microsoft\Windows\Explorer\iconcache_16.db successfuly (0x000000000000065C)
ModLoad: 00007ffd`90280000 00007ffd`90321000   C:\Windows\SYSTEM32\policymanager.dll
This application verifier technique is an interesting one, and fairly easy to use. The full example can be found at https://github.com/zodiacon/VerifierDLL.
A little-known feature in modern Windows is the ability to expose hierarchical data using the file system. This is called Windows Projected File System (ProjFS), available since Windows 10 version 1809. There is even a sample that exposes the Registry hierarchy using this technology. Using the file system as a “projection” mechanism provides a couple of advantages over a custom mechanism:
Any file viewing tool can present the information such as Explorer, or commands in a terminal.
“Standard” file APIs are used, which are well-known, and available in any programming language or library.
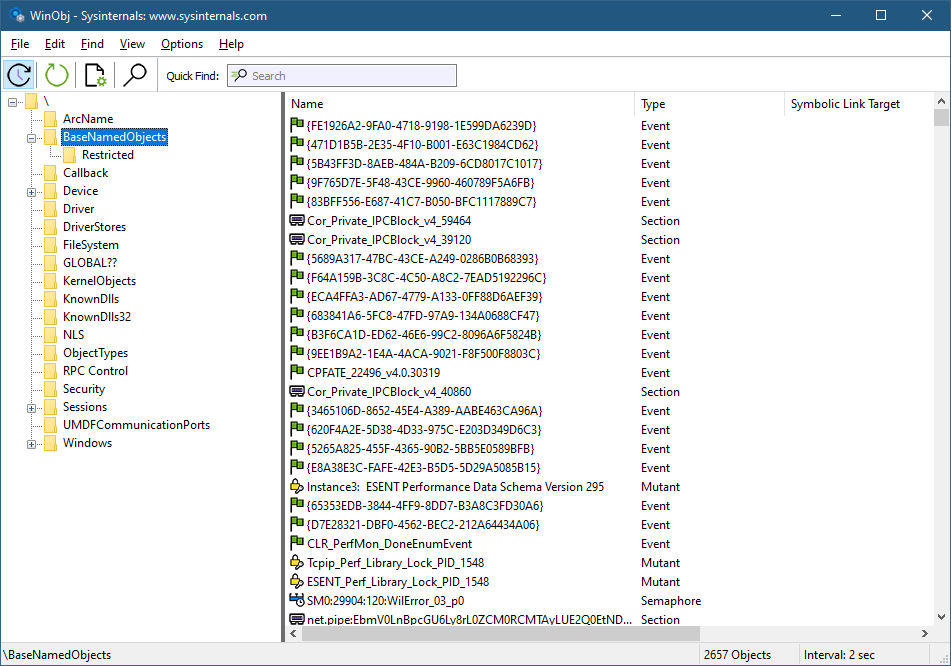
Let’s see how to build a Projected File System provider from scratch. We’ll expose object manager directories as file system directories, and other types of objects as “files”. Normally, we can see the object manager’s namespace with dedicated tools, such as WinObj from Sysinternals, or my own Object Explorer:
WinObj showing parts of the object manager namespace
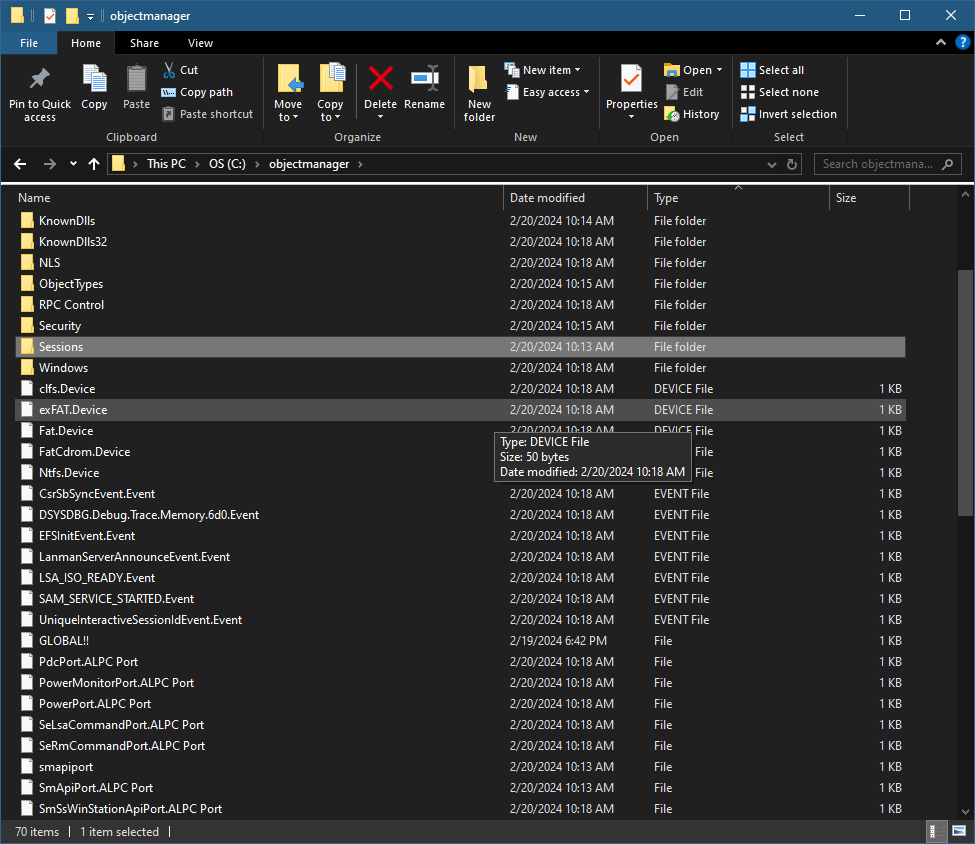
Here is an example of what we are aiming for (viewed with Explorer):
Explorer showing the root of the object manager namespace
First, support for ProjFS must be enabled to be usable. You can enable it with the Windows Features dialog or PowerShell:
projectedfslib.h is where the ProjFS declarations reside. projectedfslib.lib is the import library to link against. In this post, I’ll focus on the main coding aspects, rather than going through every little piece of code. The full code can be found at https://github.com/zodiacon/objmgrprojfs. It’s of course possible to use other languages to implement a ProjFS provider. I’m going to attempt one in Rust in a future post 🙂
The projected file system must be rooted in a folder in the file system. It doesn’t have to be empty, but it makes sense to use such a directory for this purpose only. The main function will take the requested root folder as input and pass it to the ObjectManagerProjection class that is used to manage everything:
int wmain(int argc, const wchar_t* argv[]) {
	if (argc < 2) {
		printf("Usage: ObjMgrProjFS <root_dir>\n");
		return 0;
	}

	ObjectManagerProjection omp;
	if (auto hr = omp.Init(argv[1]); hr != S_OK)
		return Error(hr);

	if (auto hr = omp.Start(); hr != S_OK)
		return Error(hr);

	printf("Virtualizing at %ws. Press ENTER to stop virtualizing...\n", argv[1]);
	char buffer[3];
	gets_s(buffer);

	omp.Term();

	return 0;
}
Let start with the initialization. We want to create the requested directory (if it doesn’t already exist). If it does exist, we’ll use it. In fact, it could exist because of a previous run of the provider, so we can keep track of the instance ID (a GUID) so that the file system itself can use its caching capabilities. We’ll “hide” the GUID in a hidden file within the directory. First, create the directory:
HRESULT ObjectManagerProjection::Init(PCWSTR root) {
	GUID instanceId = GUID_NULL;
	std::wstring instanceFile(root);
	instanceFile += L"\\_obgmgrproj.guid";

	if (!::CreateDirectory(root, nullptr)) {
		//
		// failed, does it exist?
		//
		if (::GetLastError() != ERROR_ALREADY_EXISTS)
			return HRESULT_FROM_WIN32(::GetLastError());
If creation fails not because it exists, bail out with an error. Otherwise, get the instance ID that may be there and use that GUID if present:
If we need to generate a new GUID, we’ll do that with CoCreateGuid and write it to the hidden file:
if (instanceId == GUID_NULL) {
	::CoCreateGuid(&instanceId);
	//
	// write instance ID
	//
	auto hFile = ::CreateFile(instanceFile.c_str(), GENERIC_WRITE, 0, nullptr, CREATE_NEW, FILE_ATTRIBUTE_HIDDEN, nullptr);
	if (hFile != INVALID_HANDLE_VALUE) {
		DWORD ret;
		::WriteFile(hFile, &instanceId, sizeof(instanceId), &ret, nullptr);
		::CloseHandle(hFile);
	}
}
Finally, we must register the root with ProjFS:
auto hr = ::PrjMarkDirectoryAsPlaceholder(root, nullptr, nullptr, &instanceId);
if (FAILED(hr))
	return hr;

m_RootDir = root;
return hr;
Once Init succeeds, we need to start the actual virtualization. To that end, a structure of callbacks must be filled so that ProjFS knows what functions to call to get the information requested by the file system. This is the job of the Start method:
The callbacks specified above are the absolute minimum required for a valid provider. PrjStartVirtualizing returns a virtualization context that identifies our provider, which we need to use (at least) when stopping virtualization. It’s a blocking call, which is convenient in a console app, but for other cases, it’s best put in a separate thread. The this value passed in is a user-defined context. We’ll use that to delegate these static callback functions to member functions. Here is the code for StartDirectoryEnumerationCallback:
The same trick is used for the other callbacks, so that we can implement the functionality within our class. The class ObjectManagerProjection itself holds on to the following data members of interest:
EnumInfo is a structure used to keep an object directory’s contents and the current index requested by the file system. A map is used to keep track of all current enumerations. Remember, it’s the file system – multiple directory listings may be happening at the same time. As it happens, each one is identified by a GUID, which is why it’s used as a key to the map. m_VirtContext is the returned value from PrjStartVirtualizing.
ObjectNameAndType is a little structure that stores the details of an object: its name and type:
Obviously, the bulk work for the provider is centered in the callbacks. Let’s start with StartDirectoryEnumerationCallback. Its purpose is to let the provider know that a new directory enumeration of some sort is beginning. The provider can make any necessary preparations. In our case, it’s about adding a new enumeration structure to manage based on the provided enumeration GUID:
We just add a new entry to our map, since we must be able to distinguish between multiple enumerations that may be happening concurrently. The complementary callback ends an enumeration which is where we delete the item from the map:
So far, so good. The real work is centered around the GetDirectoryEnumerationCallback callback where actual enumeration must take place. The callback receives the enumeration ID and a search expression – the client may try to search using functions such as FindFirstFile / FindNextFile or similar APIs. The provided PRJ_CALLBACK_DATA contains the basic details of the request such as the relative directory itself (which could be a subdirectory). First, we reject any unknown enumeration IDs:
HRESULT ObjectManagerProjection::DoGetDirectoryEnumerationCallback(
	const PRJ_CALLBACK_DATA* callbackData, const GUID* enumerationId,
	PCWSTR searchExpression, PRJ_DIR_ENTRY_BUFFER_HANDLE dirEntryBufferHandle) {

	auto it = m_Enumerations.find(*enumerationId);
	if(it == m_Enumerations.end())
		return E_INVALIDARG;
    auto& info = it->second;
Next, we need to enumerate the objects in the provided directory, taking into consideration the search expression (that may require returning a subset of the items):
There are quite a few things happening here. ObjectManager::EnumDirectoryObjects is a helper function that does the actual enumeration of objects in the object manager’s namespace given the root directory (callbackData->FilePathName), which is always relative to the virtualization root, which is convenient – we don’t need to care where the actual root is. The compare lambda is passed to EnumDirectoryObjects to provide a filter based on the search expression. ProjFS provides the PrjFileNameMatch function we can use to test if a specific name should be returned or not. It has the logic that caters for wildcards like * and ?.
Once the results return in a vector (info.Objects), we must sort it. The file system expects returned files/directories to be sorted in a case insensitive way, but we don’t actually need to know that. PrjFileNameCompare is provided as a function to use for sorting purposes. We call sort on the returned vector passing this function PrjFileNameCompare as the compare function.
The enumeration must happen if the PRJ_CB_DATA_FLAG_ENUM_RESTART_SCAN is specified. I also enumerate if it’s the first call for this enumeration ID.
Now that we have results (or an empty vector), we can proceed by telling ProjFS about the results. If we have no results, just return success (an empty directory):
if (info.Objects.empty())
	return S_OK;
Otherwise, we must call PrjFillDirEntryBuffer for each entry in the results. However, ProjFS provides a limited buffer to accept data, which means we need to keep track of where we left off because we may be called again (without the PRJ_CB_DATA_FLAG_ENUM_RESTART_SCAN flag) to continue filling in data. This is why we keep track of the index we need to use.
The first step in the loop is to fill in details of the item: is it a subdirectory or a “file”? We can also specify the size of its data and common times like creation time, modify time, etc.:
We fill in two details: a directory or not, based on the kernel object type being “Directory”, and a file size (in case of another type object). What is the meaning of a “file size”? It can mean whatever we want it to mean, including just specifying a size of zero. However, I decided that the “data” being held in an object would be text that provides the object’s name, type, and target (if it’s a symbolic link). Here are a few example when running the provider and using a command window:
C:\objectmanager>dir p* Volume in drive C is OS Volume Serial Number is 18CF-552E
Directory of C:\objectmanager
02/20/2024 11:09 AM 60 PdcPort.ALPC Port 02/20/2024 11:09 AM 76 PendingRenameMutex.Mutant 02/20/2024 11:09 AM 78 PowerMonitorPort.ALPC Port 02/20/2024 11:09 AM 64 PowerPort.ALPC Port 02/20/2024 11:09 AM 88 PrjFltPort.FilterConnectionPort 5 File(s) 366 bytes 0 Dir(s) 518,890,110,976 bytes free
What is the meaning of the various times and file attributes? It can mean whatever you want – it might make sense for some types of data. If left at zero, the current time is used.
GetObjectSize is a helper function that calculates the number of bytes needed to keep the object’s text, which is what is reported to the file system.
Now we can pass the information for the item to ProjFS by calling PrjFillDirEntryBuffer:
The “name” of the item is comprised of the kernel object’s name, and the “file extension” is the object’s type name. This is just a matter of choice – I could have passed the object’s name only so that it would appear as a file with no extension. If the call to PrjFillDirEntryBuffer fails, it means the buffer is full, so we break out, but the index is not incremented, so we can provide the next object in the next callback that does not requires a rescan.
We have two callbacks remaining. One is GetPlaceholderInformationCallback, whose purpose is to provide “placeholder” information about an item, without providing its data. This is used by the file system for caching purposes. The implementation is like so:
HRESULT ObjectManagerProjection::DoGetPlaceholderInformationCallback(const PRJ_CALLBACK_DATA* callbackData) {
	auto path = callbackData->FilePathName;
	auto dir = ObjectManager::DirectoryExists(path);
	std::optional<ObjectNameAndType> object;
	if (!dir)
		object = ObjectManager::ObjectExists(path);
	if(!dir && !object)
		return HRESULT_FROM_WIN32(ERROR_FILE_NOT_FOUND);

	PRJ_PLACEHOLDER_INFO info{};
	info.FileBasicInfo.IsDirectory = dir;
	info.FileBasicInfo.FileSize = dir ? 0 : GetObjectSize(path, object.value());
	return PrjWritePlaceholderInfo(m_VirtContext, callbackData->FilePathName, &info, sizeof(info));
}
The item could be a file or a directory. We use the file path name provided to figure out if it’s a directory kernel object or something else by utilizing some helpers in the ObjectManager class (we’ll examine those later). Then the structure PRJ_PLACEHOLDER_INFO is filled with the details and provided to PrjWritePlaceholderInfo.
The final required callback is the one that provides the data for files – objects in our case:
HRESULT ObjectManagerProjection::DoGetFileDataCallback(const PRJ_CALLBACK_DATA* callbackData, UINT64 byteOffset, UINT32 length) {
	auto object = ObjectManager::ObjectExists(callbackData->FilePathName);
	if (!object)
		return HRESULT_FROM_WIN32(ERROR_FILE_NOT_FOUND);

	auto buffer = ::PrjAllocateAlignedBuffer(m_VirtContext, length);
	if (!buffer)
		return E_OUTOFMEMORY;

	auto data = GetObjectData(callbackData->FilePathName, object.value());
	memcpy(buffer, (PBYTE)data.c_str() + byteOffset, length);
	auto hr = ::PrjWriteFileData(m_VirtContext, &callbackData->DataStreamId, buffer, byteOffset, length);
	::PrjFreeAlignedBuffer(buffer);

	return hr;
}
First we check if the object’s path is valid. Next, we need to allocate buffer for the data. There are some ProjFS alignment requirements, so we call PrjAllocateAlignedBuffer to allocate a properly-aligned buffer. Then we get the object data (a string, by calling our helper GetObjectData), and copy it into the allocated buffer. Finally, we pass the buffer to PrjWriteFileData and free the buffer. The byte offset provided is usually zero, but could theoretically be larger if the client reads from a non-zero position, so we must be prepared for it. In our case, the data is small, but in general it could be arbitrarily large.
GetObjectData itself looks like this:
std::wstring ObjectManagerProjection::GetObjectData(PCWSTR fullname, ObjectNameAndType const& info) {
	std::wstring target;
	if (info.TypeName == L"SymbolicLink") {
		target = ObjectManager::GetSymbolicLinkTarget(fullname);
	}
	auto result = std::format(L"Name: {}\nType: {}\n", info.Name, info.TypeName);
	if (!target.empty())
		result = std::format(L"{}Target: {}\n", result, target);
	return result;
}
It calls a helper function, ObjectManager::GetSymbolicLinkTarget in case of a symbolic link, and builds the final string by using format (C++ 20) before returning it to the caller.
That’s all for the provider, except when terminating:
Looking into the ObjectManager helper class is somewhat out of the focus of this post, since it has nothing to do with ProjFS. It uses native APIs to enumerate objects in the object manager’s namespace and get details of a symbolic link’s target. For more information about the native APIs, check out my book “Windows Native API Programming” or search online. First, it includes <Winternl.h> to get some basic native functions like RtlInitUnicodeString, and also adds the APIs for directory objects:
Here is the main code that enumerates directory objects (some details omitted for clarity, see the full source code in the Github repo):
std::vector<ObjectNameAndType> ObjectManager::EnumDirectoryObjects(PCWSTR path,
	PCWSTR objectName, std::function<bool(PCWSTR)> compare) {
	std::vector<ObjectNameAndType> objects;
	HANDLE hDirectory;
	OBJECT_ATTRIBUTES attr;
	UNICODE_STRING name;
	std::wstring spath(path);
	if (spath[0] != L'\\')
		spath = L'\\' + spath;

	std::wstring object(objectName ? objectName : L"");

	RtlInitUnicodeString(&name, spath.c_str());
	InitializeObjectAttributes(&attr, &name, 0, nullptr, nullptr);
	if (!NT_SUCCESS(NtOpenDirectoryObject(&hDirectory, DIRECTORY_QUERY, &attr)))
		return objects;

	objects.reserve(128);
	BYTE buffer[1 << 12];
	auto info = reinterpret_cast<OBJECT_DIRECTORY_INFORMATION*>(buffer);
	bool first = true;
	ULONG size, index = 0;
	for (;;) {
		auto start = index;
		if (!NT_SUCCESS(NtQueryDirectoryObject(hDirectory, info, sizeof(buffer), FALSE, first, &index, &size)))
			break;
		first = false;
		for (ULONG i = 0; i < index - start; i++) {
			ObjectNameAndType data;
			auto& p = info[i];
			data.Name = std::wstring(p.Name.Buffer, p.Name.Length / sizeof(WCHAR));
			if(compare && !compare(data.Name.c_str()))
				continue;
			data.TypeName = std::wstring(p.TypeName.Buffer, p.TypeName.Length / sizeof(WCHAR));
			if(!objectName)
				objects.push_back(std::move(data));
			if (objectName && _wcsicmp(object.c_str(), data.Name.c_str()) == 0 ||
				_wcsicmp(object.c_str(), (data.Name + L"." + data.TypeName).c_str()) == 0) {
				objects.push_back(std::move(data));
				break;
			}
		}
	}
	::CloseHandle(hDirectory);
	return objects;
}
NtQueryDirectoryObject is called in a loop with increasing indices until it fails. The returned details for each entry is the object’s name and type name.
The example provided is the bare minimum needed to write a ProjFS provider. This could be interesting for various types of data that is convenient to access with I/O APIs. Feel free to extend the example and resolve any bugs.
I promised this class a while back, and now it is happening. This is a brand new, 3 day class, split into 6 half-days, that covers the x64 processor architecture, programming in general, and programming in the context of Windows. The syllabus can be found here. It may change a bit, but should mostly be stable.
Dates are listed below. The times are 12pm-4pm EST (9am-1pm PST) (5pm-9pm UT) January: 15, 17, 22, 24, 29, 31.
Cost: 750 USD (if paid by an individual), 1400 USD if paid by a company.
Registration
If you’d like to register, please send me an email to zodiacon@live.com and provide your full name, company (if any), preferred contact email, and your time zone. Previous participants in my classes get 10% off.
The sessions will be recorded, so you can watch any part you may be missing, or that may be somewhat overwhelming in “real time”.
As usual, if you have any questions, feel free to send me an email, or DM on X (twitter) or Linkedin.
When a thread is created, it has some priority, which sets its importance compared to other threads competing for CPU time. The thread priority range is 0 to 31 (31 being the highest), where priority zero is used by the memory manager’s zero-page thread(s), whose purpose is to zero out physical pages (for reasons outside the scope of this post), so technically the allowed priority range is 1 to 31.
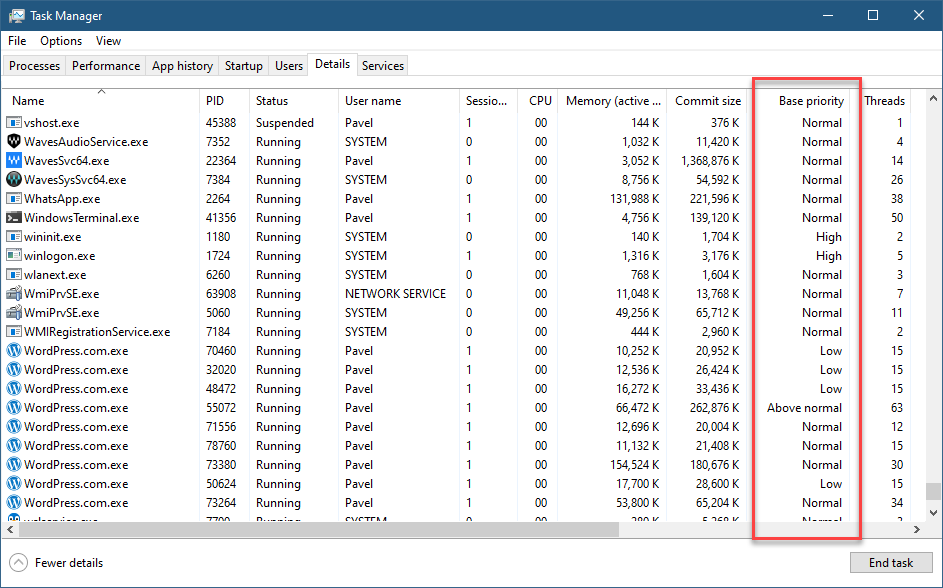
It stands to reason (to some extent), that a developer could change a thread’s priority to some valid value in the range of 1 to 31, but this is not the case. The Windows API sets up rules as to how thread priorities may change. First, there is a process priority class (sometimes called Base Priority), that specifies the default thread priority within that process. Processes don’t run – threads do, but still this is a process property and affects all threads in the process. You can see the value of this property very simply with Task Manager’s Base Priority column (not visible by default):
Base Priority column in Task Manager
There are six priority classes (the priority of which is specified after the colon):
Idle (called Low in Task Manager, probably not to give the wrong impression): 4
Below Normal (6)
Normal (8)
Above Normal (10)
Highest (13)
Realtime (24)
A few required notes:
Normal is the default priority class unless overridden in some way. For example, double-clicking an executable in Explorer will launch a new process with priority class of Normal (8).
The term “Realtime” does not imply Windows is a real-time OS; it’s not. “Real-time” just means “higher than all the others”.
To set the Realtime priority class, the process in question must have the SeIncreaseBasePriorityPrivilege, normally granted to administrators. If “Realtime” is requested, but the process’s token does not poses that privilege, the result is “High”. The reason has do to with the fact that many kernel threads have priorities in the real-time range, and it could be problematic if too many threads spend a lot of time running in these priorities, potentially leading to kernel threads getting less time than they need.
Is this the end of the story? Not quite. For example, looking at Task Manager, processes like Csrss.exe (Windows subsystem process) or Smss.exe (Session manager) seem to have a priority class of Normal as well. Is this really the case? Yes and no (everyone likes that kind of answer, right?) We’ll get to that soon.
Setting a Thread’s priority
Changing the process priority class is possible with the SetPriorityClassAPI. For example, a process can change its own priority class like so:
You can also change priority class using Task Manager or Process Explorer, by right-clicking a process and selecting “Set Priority”.
Once the priority class is changed, it affects all threads in that process. But how?
It turns out that a specific thread’s priority can be changed around the process priority class. The following diagram shows the full picture:
Every small rectangle in the above diagram indicates a valid thread priority. For example, the Normal priority classes allows setting thread priorities to 1, 6, 7, 8, 9, 10, 15. To be more generic, here are the rules for all except the Realtime class. A thread priority is by default the same as the process priority class, but it can be -1, -2, +1, +2 from that base, or have two extreme values (internally called “Saturation”) with the values 1 and 15.
The Realtime range is unique, where the base priority is 24, but all priorities from 16 to 31 are available. The SetThreadPriorityAPI that can be used to change an individual thread’s priority accepts an enumeration value (as its second argument) rather than an absolute value. Here are the macro definitions:
You can see threads priorities in Process Explorer‘s bottom view:
Thread priorities in Process Explorer
There are two columns for priorities – A base priority and a Dynamic priority. The base priority is the priority set by code (SetThreadPriority) or the default, while the dynamic priority is the current thread’s priority, which could be slightly higher than the base (temporarily), and is changed because of certain decisions made by the kernel scheduler and other components and drivers that can produce such an effect. These thread boosting scenarios are outside the scope of this post.
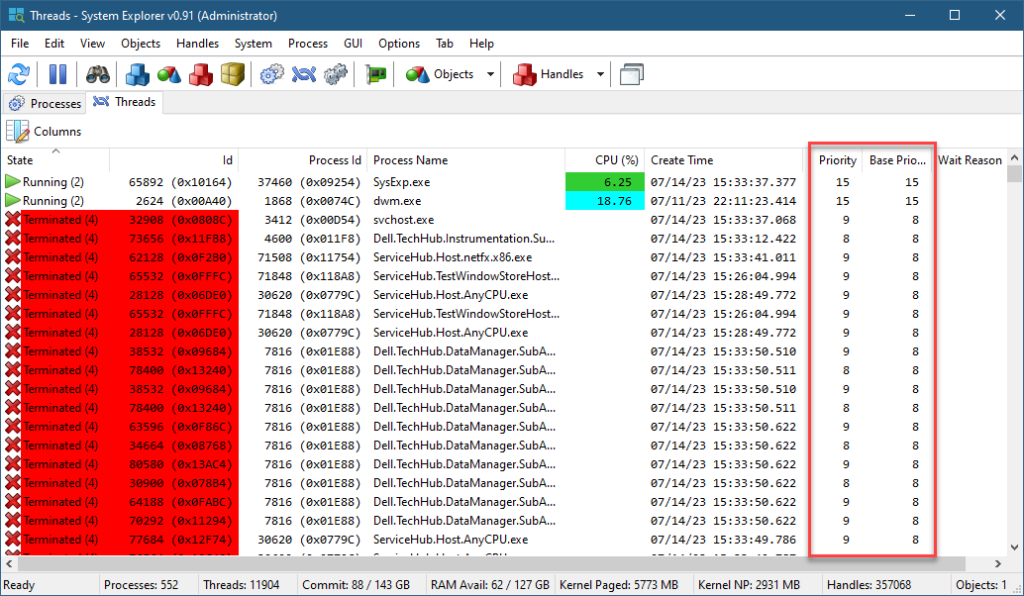
If you want to see all threads in the system with their priorities, you can use my System Explorer tool, and select System / Threads menu item:
System Explorer showing all threads in the system
The two priority column are shown (Priority is the same as Dynamic Priority in Process Explorer). You can sort by any column, including the priority to see which threads have the highest priority.
Native APIs
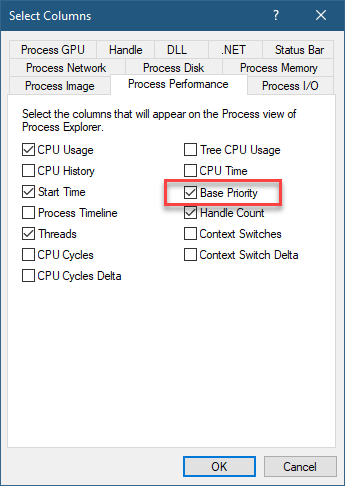
If you look in Process Explorer, there is a column named Base Priority under the Process Performance tab:
Process Performance tab
With this column visible, it indicates a process priority with a number. It’s mostly the corresponding number to the priority class (e.g. 10 for Above Normal, 13 for High, etc.), but not always. For example, Smss.exe has a value of 11, which doesn’t correspond to any priority class. Csrss.exe processes have a value of 13.
Changing to these numbers can only be done with the Native API. Specifically, NtSetInformationProcess with the ProcessBasePriority enumeration value can make that change. Weirdly enough, if the value is higher than the current process priority, the same privilege mentioned earlier is required. The weird part, is that calling SetPriorityClass to change Normal to High always works, but calling NtSetInformationProcess to change from 8 to 13 (the same as Normal to High) requires that privilege; oh, well.
What about a specific thread? The native API allows changing a priority of a thread to any given value directly without the need to depend on the process priority class. Choosing a priority in the realtime range (16 or higher) still requires that privilege. But at least you get the flexibility to choose any priority value. The call to use is NtSetInformationThread with ThreadPriority enumeration. For example:
Note: the definitions for the native API can be obtained from the phnt project.
What happens if you need a high priority (16 or higher) but don’t have admin privileges in the process? Enter the Multimedia Class Scheduler.
The MMCSS Service
The multimedia class service coupled with a driver (mmcss.sys) provide a thread priority service intended for “multimedia” applications that would like to get some guarantee when “playing” multimedia. For example, if you have Spotify running locally, you’ll find there is one thread with priority 22, although the process itself has a priority class Normal:
Spotify threads
You can use the MMCSS API to get that kind of support. There is a Registry key that defines several “tasks” applications can use. Third parties can add more tasks:
MMCSS tasks
The base key is: HKLM\SOFTWARE\Microsoft\Windows NT\CurrentVersion\Multimedia\SystemProfile\Tasks
The selected “Audio” task has several properties that are read by the MMCSS service. The most important is Priority, which is between 1 (low) and 8 (high) representing the relative priority compared to other “tasks”. Some values aren’t currently used (GPU Priority, SFIO Priority), so don’t expect anything from these.
Here is an example that uses the MMCSS API to increase the current thread’s priority:
#include <Windows.h>
#include <avrt.h>

#pragma comment(lib, "avrt")

int main() {
	DWORD index = 0;
    HANDLE h = AvSetMmThreadCharacteristics(L"Audio", &index);
	AvSetMmThreadPriority(h, AVRT_PRIORITY_HIGH);
The priority itself is an enumeration, where each value corresponds to a range of priorities (all above 15).
The returned HANDLE by the way, is to the MMCSS device (\Device\MMCSS). The argument to AvSetMmThreadCharacteristicsmust correspond to one of the “Tasks” registered. Calling AvRevertMmThreadCharacteristicsreverts the thread to “normal”. There are more APIs in that set, check the docs.
Much of the Windows kernel functionality is exposed via kernel objects. Processes, threads, events, desktops, semaphores, and many other object types exist. Some object types can have string-based names, which means they can be “looked up” by that name. In this post, I’d like to consider some subtleties that concern object names.
Let’s start by examining kernel object handles in Process Explorer. When we select a process of interest, we can see the list of handles in one of the bottom views:
Handles view in Process Explorer
However, Process Explorer shows what it considers handles to named objects only by default. But even that is not quite right. You will find certain object types in this view that don’t have string-based names. The simplest example is processes. Processes have numeric IDs, rather than string-based names. Still, Process Explorer shows processes with a “name” that shows the process executable name and its unique process ID. This is useful information, for sure, but it’s not the object’s name.
Same goes for threads: these are displayed, even though threads (like processes) have numeric IDs rather than string-based names.
If you wish to see all handles in a process, you need to check the menu item Show Unnamed Handles and Mappings in the View menu.
Object Name Lifetime
What is the lifetime associated with an object’s name? This sounds like a weird question. Kernel objects are reference counted, so obviously when an object reference count drops to zero, it is destroyed, and its name is deleted as well. This is correct in part. Let’s look a bit deeper.
The following example code creates a Notepad process, and puts it into a named Job object (error handling omitted for brevity):
After running the above code, we can open Process Explorer, locate the new Notepad process, double-click it to get to its properties, and then navigate to the Job tab:
We can clearly see the job object’s name, prefixed with “\Sessions\1\BaseNamedObjects” because simple object names (like “MyTestJob”) are prepended with a session-relative directory name, making the name unique to this session only, which means processes in other sessions can create objects with the same name (“MyTestJob”) without any collision. Further details on names and sessions is outside the scope of this post.
Let’s see what the kernel debugger has to say regarding this job object:
Clearly, there is a single handle to the job object. The PointerCount value is not the real reference count because of the kernel’s tracking of the number of usages each handle has (outside the scope of this post as well). To get the real reference count, we can click the PointerCount DML link in WinDbg (the !truref command):
The handle count dropped to zero because we closed our (only) existing handle to the job. The job object’s name seem to be intact at first glance, but not really: The directory object is NULL, which means the object’s name is no longer visible in the object manager’s namespace.
Is the job object alive? Clearly, yes, as the pointer (reference) count is 1. When the handle count it zero, the Pointer Count is the correct reference count, and there is no need to run the !truref command. At this point, you should be able to guess why the object is still alive, and where is that one reference coming from.
If you guessed “the Notepad process”, then you are right. When a process is added to a job, it adds a reference to the job object so that it remains alive if at least one process is part of the job.
We, however, have lost the only handle we have to the job object. Can we get it back knowing the object’s name?
This call fails, and GetLastError returns 2 (“the system cannot find the file specified”, which in this case is the job object’s name). This means that the object name is destroyed when the last handle of the object is closed, even if there are outstanding references on the object (the object is alive!).
This the job object example is just that. The same rules apply to any named object.
Is there a way to “preserve” the object name even if all handles are closed? Yes, it’s possible if the object is created as “Permanent”. Unfortunately, this capability is not exposed by the Windows API functions like CreateJobObject, CreateEvent, and all other create functions that accept an object name.
Quick update: The native NtMakePermanentObject can make an object permanent given a handle, if the caller has the SeCreatePermanent privilege. This privilege is not granted to any user/group by default.
A permanent object can be created with kernel APIs, where the flag OBJ_PERMANENT is specified as one of the attribute flags part of the OBJECT_ATTRIBUTES structure that is passed to every object creation API in the kernel.
A “canonical” kernel example is the creation of a callback object. Callback objects are only usable in kernel mode. They provide a way for a driver/kernel to expose notifications in a uniform way, and allow interested parties (drivers/kernel) to register for notifications based on that callback object. Callback objects are created with a name so that they can be looked up easily by interested parties. In fact, there are quite a few callback objects on a typical Windows system, mostly in the Callback object manager namespace:
Most of the above callback objects’ usage is undocumented, except three which are documented in the WDK (ProcessorAdd, PowerState, and SetSystemTime). Creating a callback object with the following code creates the callback object but the name disappears immediately, as the ExCreateCallback API returns an object pointer rather than a handle:
PCALLBACK_OBJECT cb;
UNICODE_STRING name = RTL_CONSTANT_STRING(L"\\Callback\\MyCallback");
OBJECT_ATTRIBUTES cbAttr = RTL_CONSTANT_OBJECT_ATTRIBUTES(&name,
    OBJ_CASE_INSENSITIVE);
status = ExCreateCallback(&cb, &cbAttr, TRUE, TRUE);
The correct way to create a callback object is to add the OBJ_PERMANENT flag:
PCALLBACK_OBJECT cb;
UNICODE_STRING name = RTL_CONSTANT_STRING(L"\\Callback\\MyCallback");
OBJECT_ATTRIBUTES cbAttr = RTL_CONSTANT_OBJECT_ATTRIBUTES(&name,
    OBJ_CASE_INSENSITIVE | OBJ_PERMANENT);
status = ExCreateCallback(&cb, &cbAttr, TRUE, TRUE);
A permanent object must be made “temporary” (the opposite of permanent) before actually dereferencing it by calling ObMakeTemporaryObject.
Aside: Getting to an Object’s Name in WinDbg
For those that wonder how to locate an object’s name give its address. I hope that it’s clear enough… (watch the bold text).