
In the Linux world, the eBPF technology has been around for years. Its purpose is to allow writing programs that run within the Linux kernel. However, contrary to standard kernel modules, eBPF runs in a constrained environment, its API is limited as to not hurt the kernel. Furthermore, every eBPF program must be verified before it’s allowed to execute, to ensure it’s safe (like memory safety, no infinite loops, and more) and cannot cause any damage to the system.
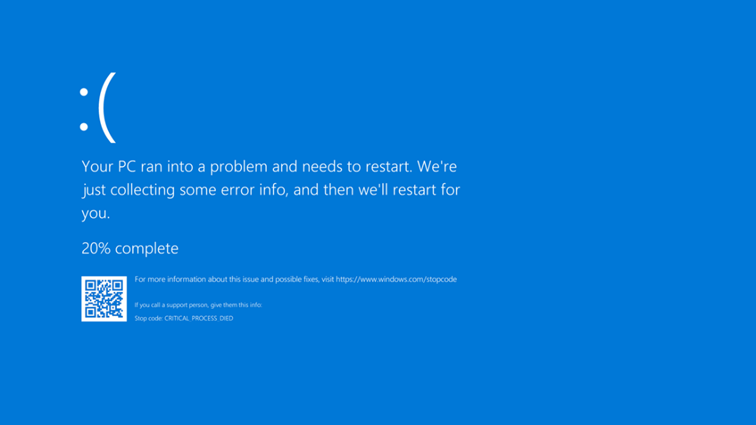
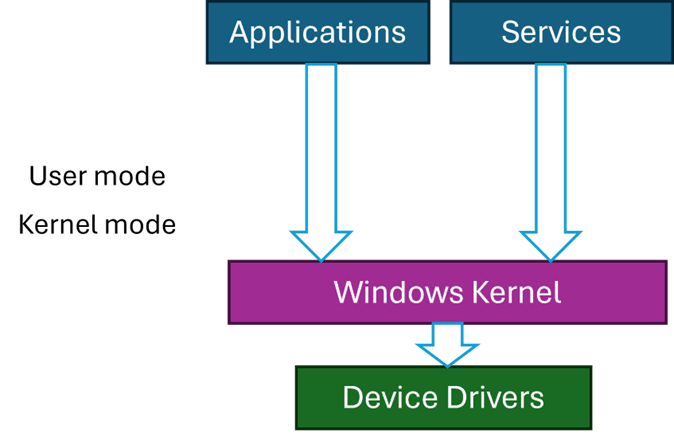
Microsoft began a project a few years ago, openly worked on Github to create a Windows version of eBPF. We all know there is an inherent risk running kernel drivers on Windows – any such driver can compromise the system in all sorts of ways, not to mention crashing it (“Blue Screen of Death“), as was painfully evident in the CrowdStrike incident on July 19, 2024. Kernel drivers cannot just go away, however. The best Microsoft can do is make every effort to ensure reliability and quality of kernel drivers. eBPF just might be a good step in that direction, as it does not allow unconstrained access to kernel APIs.
(eBPF stands for “Extended Berkley Packet Filter”, the original usage of the technology. eBPF does not stand for anything now, because its usage goes beyond network packet filtering. Look for more information online or in the book “Learning eBPF” by Liz Rice about the origins of eBPF).
The Readme file in the root of the eBPF-for-Windows repository does a good job of explaining the eBPF architecture on Windows, and how to get started. In this post, I’d like to show an example of building an eBPF program, running it, and observing the results.
Disclaimer: This post is based on my (limited) experience with eBPF for Windows.
Getting Started
There are a couple of ways to get started with eBPF on Windows, the simplest being using the MSI installer provided as part of the Releases. At the time of writing, version 0.20 is the latest one. You can grab an MSI for your VM’s platform, or even grab the full directory (Debug or Release) with all build artifacts as through you have built it yourself. This is useful for debugging purposes (PDB files are provided), and also having all the samples and tests available is beneficial if you’d like to learn more. Here, I’m going to go with the MSI for simplicity.
You will need a Virtual Machine that is configured to run in test signing mode, so that the eBPF drivers themselves (and your programs, for that matter) are able to load without being signed by a trusted certificate. Use the following elevated command line to get into test signing mode (restart is required):
bcdedit /set testsigning onNow you can install the MSI, which presents a classic Windows installation experience – just click Next on every page.
Writing an eBPF Program
eBPF programs are classically written in C, although other options are available today (Rust, Python, …); I’ll stick with C. An eBPF program is compiled to an intermediate language, leveraging an eBPF virtual machine. This allows eBPF compiled code to be generic, based on a virtual CPU, so that it can later be compiled to the actual target processor on the system. Two modes are available for this: JIT and Native. With JIT, some entity compiles the eBPF byte code before the first invocation – this could be part of the kernel, or some entity running in user mode that then pushes the resulting code to the kernel.
The eBPF for Windows implementation provides a user-mode service that can JIT-compile eBPF byte code (provided as an ELF object file) and then pushing the result to the kernel. This JIT mode, however, is currently being deprecated, so may or may not be supported in the future. The other option is Native – the byte code is compiled to the target machine and generates a normal PE, which is in fact a kernel driver. Verification is also performed at this stage, where compilation fails if verification fails.
The details of exactly how all this works is beyond the scope of this post. The documentation in the eBPF-for-Windows repo should shed more light on the details. I may provide more information in a future post.
To actually write the eBPF program, we could use any editor, and use the clang compiler to generate the eBPF byte code, wrapped in an ELF binary file (eBPF-for-Windows tries to be as compatible as possible to the Linux way of working, so uses clang that compiles to an ELF file, not a PE). We can certainly go down that route, but to make things somewhat easier, I will be using Visual Studio and Nuget to simplify getting the required header files and libraries.
Creating the Project
We create a new C++ console application, as there is no eBPF or similar template available. We could also write normal C++ code to load the program into the kernel (once properly compiled), but I’m not going to do this in this post. Instead, we’ll use the netsh tool, that has been extended with an eBPF provided DLL that allows loading programs and a few other operations. For now, let’s continue with Visual Studio. The project I created is named TraceConnections. Its purpose is going to be counting the number of TCP connect operations that occur per process.
I rename the resulting TestConnections.cpp file to TestConnection.c so we don’t use any C++ feature – eBPF supports C only. Next, we need to use eBPF specific headers and other tools – fortunately, these are available through a Nuget package. Just open the Nuget Packages window and search for “ebpf”. You’ll find 3 packages targeting x86, ARM64 and x64. Choose the package based on the target (most likely x64) and install it:

Now we can begin coding.
Writing an eBPF Program
We start with two includes, provided by the Nuget package:
#include <bpf_helpers.h>
#include <ebpf_nethooks.h>
A eBPF program starts in a function that can have any name, but must have a prototype based on the “type” of program. For our purposes, it’s a program that “binds” to network connections. We start the function like so:
SEC("bind")
bind_action_t TraceConnections(bind_md_t* ctx) {
The function name is TraceConnections, it accepts one pointer and returns an enumeration indicating whether to allow or block the connection:
typedef enum _bind_action {
    BIND_PERMIT,   ///< Permit the bind operation.
    BIND_DENY,     ///< Deny the bind operation.
    BIND_REDIRECT, ///< Change the bind endpoint.
} bind_action_t;
This gives you an idea how easy it would be to block a connection if we so desire. The accepted pointer’s type to the main function depends on the kind of “program” we write. In this case, it’s bind_md_t providing details about the connection:
typedef struct _bind_md {
    uint8_t* app_id_start;         ///< Pointer to start of App ID.
    uint8_t* app_id_end;           ///< Pointer to end of App ID.
    uint64_t process_id;           ///< Process ID.
    uint8_t socket_address[16];    ///< Socket address to bind to.
    uint8_t socket_address_length; ///< Length in bytes of the socket address.
    bind_operation_t operation;    ///< Operation to do.
    uint8_t protocol;              ///< Protocol number (e.g., IPPROTO_TCP).
} bind_md_t;
We get some basic details, like process ID, process name, and network address. The SEC macro places the code in a section called “bind”, which is one way to tell eBPF what kind of program we’re writing.
In this example, we’d like to keep track of all processes making network connections, and just count how many such connections occur. For this purpose, we can create a helper structure:
typedef struct _process_info {
	uint32_t id;
	char name[32];
	uint32_t count;
} process_info;
We’ll keep track of the process ID, an executable name, and the count itself. The next question is where is all that going to be stored?
eBPF works with the concept of maps, which you can think of as key/value pairs, where keys could be managed in multiple ways, based on the map type. To define a map, we can build a structure with some helper macros, and place any variable(s) in a section called “.maps” in the resulting ELF object file. For this example, this is the map I defined:
struct {
	__uint(type, BPF_MAP_TYPE_HASH);
	__type(key, uint32_t);
	__type(value, process_info);
	__uint(max_entries, 1024);
} proc_map SEC(".maps");
type indicates the map type (a hash table), the key is the process ID (to uniquely identify the process being tracked), value is our process_info structure. Finally, max_entries is a hint to the map implementation, as to how many items are expected. A global variable named proc_map resperesnts our map. Now we’re ready to implement the body of our function. First, we’ll look at bind to port operations only (not unbind), and we always permit the connection to continue:
SEC("bind")
bind_action_t TraceConnections(bind_md_t* ctx) {
	if (ctx->operation == BIND_OPERATION_BIND) {
	}
	return BIND_PERMIT;
}
Next, we grab the process ID, and look it up in the map. If it’s already there, just increment the count:
uint32_t pid = (uint32_t)ctx->process_id;
process_info pi = { 0 };
process_info* p = bpf_map_lookup_elem(&proc_map, &pid);
if (p) {
	p->count++;
}
If not, we need to create a new entry by populating a new process_info:
else {
	pi.id = pid;
	memcpy(pi.name, ctx->app_id_start,
        MIN(sizeof(pi.name), ctx->app_id_end - ctx->app_id_start));
	pi.count = 1;
	p = π
}
Finally, we need to update the map with the new or updated value:
bpf_map_update_elem(&proc_map, &pid, p, 0);
The arguments are (in order): the map variable, pointer to the key, pointer to the value, and flags indicating whether to update if there is already a value, or update always, etc; zero means update if exists, or create if does not exist.
That’s almost it! Just need to add a license for verification purposes (the exact details are not important for this post):
char LICENSE[] SEC("license") = "Dual BSD/GPL";
Here is the full code for easier reference:
#include <bpf_helpers.h>
#include <ebpf_nethooks.h>
#define MIN(x, y) ((x) < (y)) ? (x) : (y)
typedef struct _process_info {
uint32_t id;
char name[32];
uint32_t count;
} process_info;
struct {
__uint(type, BPF_MAP_TYPE_HASH);
__type(key, uint32_t);
__type(value, process_info);
__uint(max_entries, 1024);
} proc_map SEC(".maps");
SEC("bind")
bind_action_t TraceConnections(bind_md_t* ctx) {
if (ctx->operation == BIND_OPERATION_BIND) {
uint32_t pid = (uint32_t)ctx->process_id;
process_info pi = { 0 };
process_info* p = bpf_map_lookup_elem(&proc_map, &pid);
if (p) {
p->count++;
}
else {
pi.id = pid;
memcpy(pi.name, ctx->app_id_start,
MIN(sizeof(pi.name), ctx->app_id_end - ctx->app_id_start));
pi.count = 1;
p = π
}
bpf_map_update_elem(&proc_map, &pid, p, 0);
}
return BIND_PERMIT;
}
char LICENSE[] SEC("license") = "Dual BSD/GPL";
Compiling the Program
This is where things get a bit hairy. First, we need a clang compiler. The Visual Studio installer offers a clang compiler and related tools, but it seems it does not support an eBPF target (use clang -print-targets to verify). Installing the official LLVM (version 18.1.8 at the time of writing) toolset provides clang that supports eBPF. Make sure you add the LLVM bin path to the system PATH environment variable to make it easier to access clang (the installation wizard will offer that option for convenience).
In order to set the command line for compilation, right-click the TestConnections.c file in Solution Explorer and choose Properties. In the General tab, change the Item Type to Custom Build Tool (check all platforms and configurations so you don’t have to repeat this later):

Click OK and open the properties again so they get refreshed. Now you can edit the custom tool command line. Here is what you need:
clang.exe -target bpf -g -O2 -Werror -I"../packages/eBPF-for-Windows.x64.0.20.0/build/native/include" -c %(FileName).c -o $(OutDir)%(FileName).o
pushd $(OutDir)
powershell -NonInteractive -ExecutionPolicy Unrestricted $(SolutionDir)packages\eBPF-for-Windows.x64.0.20.0\build\native\bin\Convert-BpfToNative.ps1 -FileName %(Filename) -IncludeDir $(SolutionDir)packages\eBPF-for-Windows.x64.0.20.0\build\native\include -Platform $(Platform) -Configuration $(Configuration) -KernelMode $true
popd
Let’s break it down. The first call is to the clang compiler to compile the eBPF code to an ELF object file. -g adds debug information, which will be useful in looking into the generated code (more on that later), -target bpf is obvious, -O2 is required for certain optimizations, -Werror treats warnings as errors, so they cannot be ignored, and -I is where the helper eBPF header are located from the Nuget package.
The next step is to compile the object file to a native SYS file – making the eBPF program bundled in a driver PE file. This is where the Convert-BpfToNative cmdlet comes into play. It has some strict requirements – it does not accept a full path name, so we must switch to the object file directory before proceeding; this is the role of pushd and popd.
Next, we have to set the two outputs in the Outputs line in the Custom Build tool config:
$(OutputPath)%(Filename).o
$(OutputPath)%(Filename).sys
Now we can build. If all goes well, a TestConnections.sys should be created in the output folder. We’ll copy it to somewhere on the target system (e.g. c:\Test).
Loading and Testing
In the target system, open an elevated command window, and type netsh. Then type ebpf to get into the ebpf extensions.
Type show programs to see there are no programs loaded. Now type add program c:\Test\Testconnections.sys. If that works, type show programs again, and you should see something like this:
netsh ebpf>show programs
ID  Pins  Links  Mode       Type           Name
====== ==== ===== ========= ============= ====================
 3     1        1 NATIVE     bind          TestConnections
We have a loaded program, and it’s running! You can verify that maps exist (your map and program IDs may be different):
netsh ebpf>show maps

                              Key  Value      Max  Inner
     ID            Map Type  Size   Size  Entries     ID  Pins  Name
=======  ==================  ====  =====  =======  =====  ====  ========
      2                hash     4     40     1024     -1     0  proc_map
We can see the map data by using a tool I’m working on, called eBPF Studio. You can download the latest release and run it on the target system (note: there is a release and debug versions for eBPF Studio. This is currently necessary because of the way the CRT is linked to the eBPF API). Run the Release version, and if it crashes, run the Debug one. Hopefully, this issue will be fixed in a future eBPF for Windows release.
When you run eBPF Studio, it shows the programs, maps, and links (not discussed here) currently loaded into the kernel, in three separate tabs. If you click the Maps tab, you can choose a map, and its contents are shown in the bottom part:
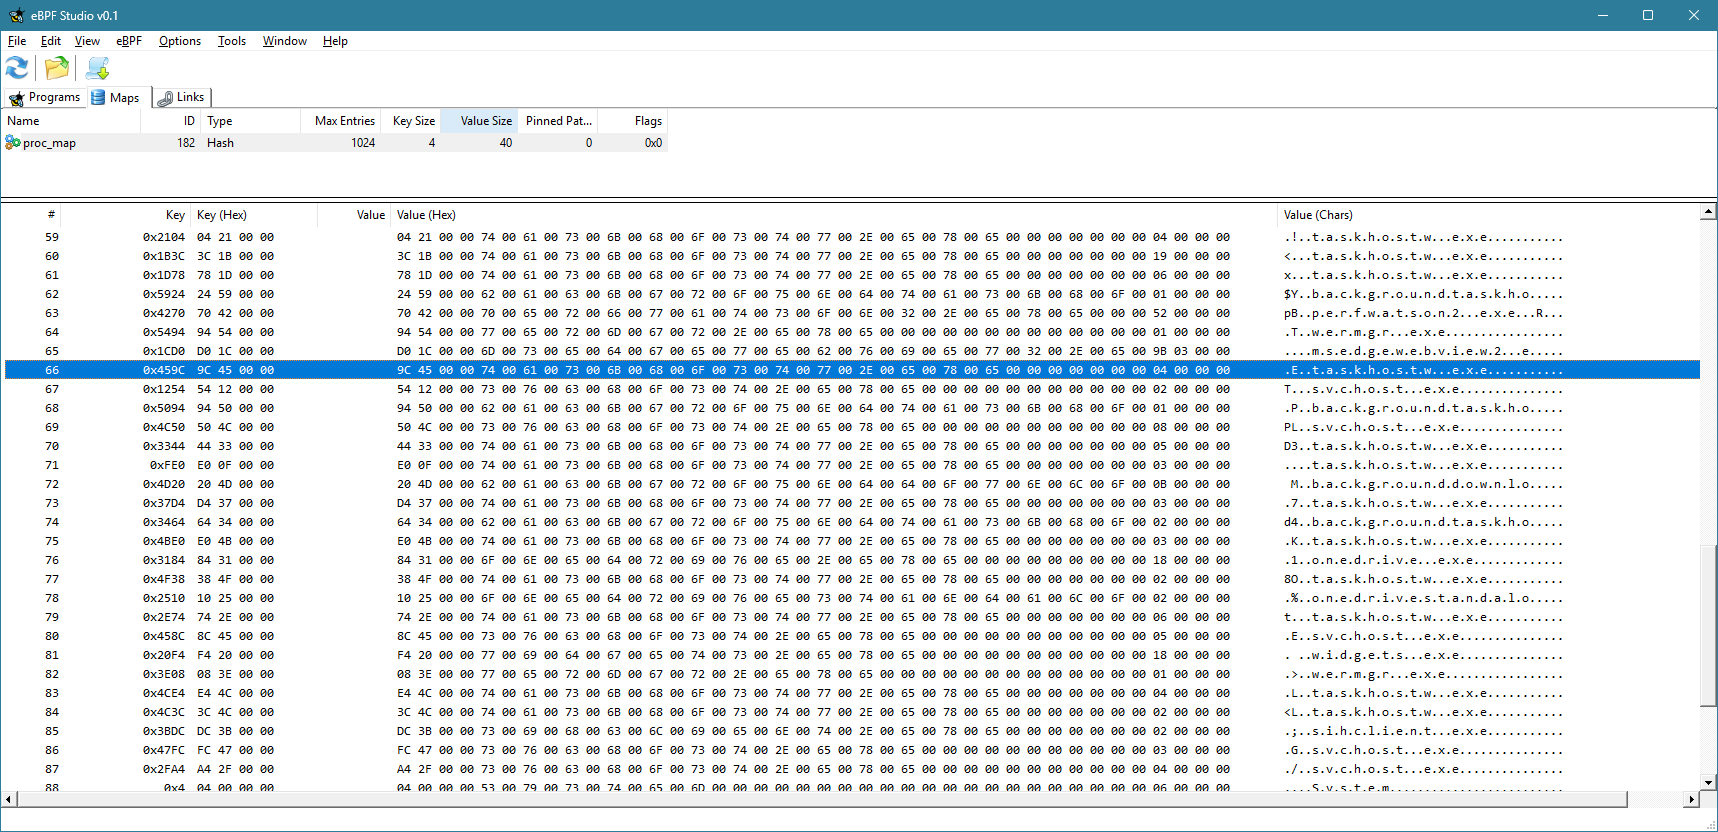
Currently, the view is not refreshed automatically. You have to click the Refresh button to refresh the maps and programs views. You can clearly see the keys (process IDs) and the values for each item in the map.
You can also use eBPF Studio to open an object file (ELF *.O files), and see their contents. Here is what you would see for TestConnections.o:

You can see the source code interspersed with eBPF “machine” instructions. Note that the -g flag mentioned earlier would allow you to see the source. Otherwise, you would only see the “assembly” instructions.
Extending the Example
Now you can add some simple functionality, like blocking a process based on its PID or executable name. I’ll leave that as an exercise to the interested reader.
The full source code is available here.