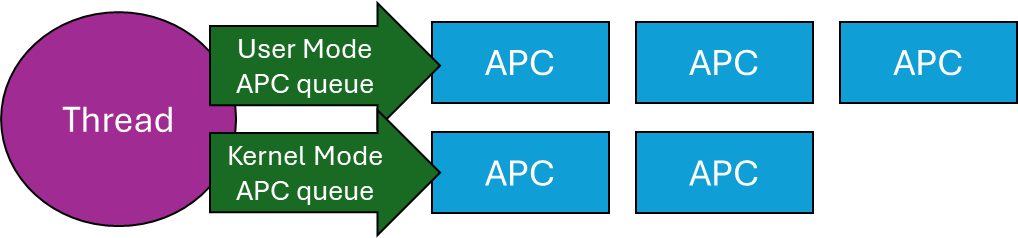
Asynchronous Procedure Calls (APCs) in Windows are objects that can be attached to threads. Every thread has its own APC queue, where an APC stores a function and arguments to call. The idea is that we’d like the a function to be executed by a specific thread, rather than some arbitrary thread. This is because the process this thread is part of is important for some reason, so the APC (when executed) has full access to that process resources.
Technically, there are user-mode, kernel-mode, and Special kernel-mode APCs, In this post I’ll discuss user mode APCs, those directly supported by the Windows API. (There is also Special user-mode APCs, but these are not generally usable). Here is a conceptual representation of a thread and its APC queues:
A Thread and its APC queues
When a user mode APC is queued to a thread (more on that later), the APC just sits there in the queue, doing nothing. To actually run the APCs currently attached to a thread, that thread must go into an alertable wait (also called alertable state). When in that state, any and all APCs in the thread’s queue execute in sequence. But how does a thread go into an alertable wait?
There are a few functions that can do that. The simplest is SleepEx, the extended Sleep function:
DWORD SleepEx(DWORD msec, BOOL alertable);
If alertable is FALSE, the function is identical to Sleep. Otherwise, the thread sleeps for the designated time (which can be zero), and if any APCs exits in its queue (or appear while it’s sleeping), will execute now, and the sleep is over, in which case the return value from SleepEx is WAIT_IO_COMPLETION rather than zero. A typical call might be SleepEx(0, TRUE) to force all queued APCs to run (if there are any). You can think of this call as a “garbage collection” of APCs. If a thread does not ever go into an alertable wait, any attached APCs will never execute.
Other ways of entering an alertable wait involve using the extended versions of the various wait functions, such as WaitForSingleObjectEx, WaitForMultipleObjectsEx, where an additional Boolean argument is accepted just like SleepEx. MsgWaitForMultipleObjectsExcan do that as well, although the alertable state is specified with a flag (MWMO_ALERTABLE) rather than a Boolean.
Now that know how user mode APCs work, we can try to put them to good use.
Asynchronous I/O Completion
The “classic” use of user mode APCs is to get notified of asynchronous I/O operations. Windows has several mechanisms for this purpose, one of which involves APCs. Specifically, the ReadFileExand WriteFileExAPIs receive an extra parameter (compared to their non-Ex variants) that is a callback to be invoked when the asynchronous I/O operation completes. The catch is, that the callback is wrapped in an APC queued to the requesting thread, which means it can only execute if/when that thread enters an alertable wait. Here is some conceptual code:
HANDLE hFile = ::CreateFile(..., FILE_FLAG_OVERLAPPED, nullptr);
OVERLAPPED ov{};
ov.Offset = ...;
::ReadFileEx(hFile, buffer, size, &ov, OnIoCompleted);
// other work...
// from time to time, execute APCs:
::SleepEx(0, TRUE);
The Completion routine has the following prototype:
In practice, this mechanism of being notified of asynchronous /O completion is not very popular, because it’s usually inconvenient to use the same thread for completion. In fact, the thread might exit before the I/O completed. Still, it’s an option that utilizes APCs.
Injecting a DLL into a Process
It’s sometimes useful to “force” somehow another process to load a DLL you provide. The classic way of achieving that is by using the CreateRemoteThreadAPI, where the “thread function” is set to the address of the LoadLibraryAPS, because a thread’s function and LoadLibrary have the same prototype from a binary perspective – both accept a pointer. LoadLibrary is passed the path of the DLL to load. You can find a video I made to show this classic technique here: https://youtu.be/0jX9UoXYLa4. A full source code example is here: https://github.com/zodiacon/youtubecode/tree/main/Injection.
The problem with this approach is that it’s pretty visible – anti-malware kernel drivers get notified when a thread is created, and if created by a thread in a different process, that may be suspicious from the driver’s perspective. By the way, the “legitimate” usage of CreateRemoteThread is for a debugger to break in forcefully to a target process in an initial attach, by forcing a new thread in the process to call DbgBreakPoint.
Using an APC, we may be able to “persuade” an existing thread to load our DLL. This is much stealthier, since it’s an existing thread loading a DLL – a very common occurrence. To achieve that, we can use the generic QueueUserAPCAPI:
Fortunately, an APC function has the same binary layout as a thread function – again receiving some kind of pointer. The main issue with this technique is that the target thread may not get into an alertable wait ever. To increase the probability of success, we can queue the APC to all threads in the target process – we just need one to enter an alertable wait. This works well for processes like Explorer, which have so many threads it practically always works. Here is a link to a video I made to show this technique: https://youtu.be/RBCR9Gvp5BM
A Natural Queue
Lastly, since APCs are stored in a queue, we can create a “work queue” very naturally just by utilizing APCs. If you need a queue of functions to be invoked sequentially, you could manage them yourself with the help of (say) std::queue<> in C++. But that queue is not thread-safe, so you would have to properly protect it. If you’re using .NET, you may use ConcurrentQueue<> to help with synchronization, but you still would need to build some kind of loop to pop items, invoke them, etc. With APCs, this all becomes natural and pretty easy:
Simplicity itself. An event object can be used to quit this infinite loop (SetEventcalled from somewhere). The thread waits for APCs to appear in its queue, and runs them when they do, returning to waiting. Clients of this queue call QueueUserAPC to enqueue work items (callbacks) to that thread. That’s it – simple and elegant.
Summary
APCs provide a way to allow callbacks to be invoked sequentially by a target thread. Maybe you can find other creative use of APCs.
Millions of machines around the world crashed a few days ago, showing the dreaded “Blue Screen of Death” (BSOD), affecting banks, airports, hospitals, and many other businesses, all using the Windows OS and CrowdStrike’s Endpoint Detection and Response (EDR) software. What was going on? How can such a calamity happen in one single swoop?
First, foul play was suspected – a cyber security attack perhaps. But it turned out to be a bad update of CrowdStrike’s “Falcon” software agent that caused all this mess. What is a BSOD anyway?
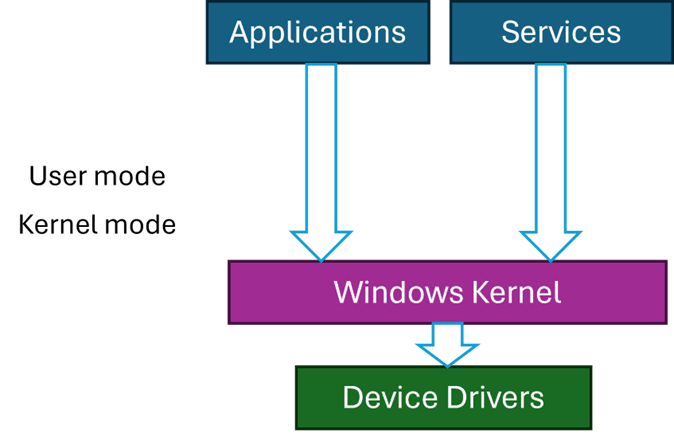
Code running on Windows can run in two primary modes – user mode and kernel mode. User mode is restricted in its access, which cannot harm the OS. This is the mode applications run with – such as Explorer, Word, Notepad, and any other application. Kernel mode, however, has (almost) unlimited power. But, as the American hero movies like to say, “With great power comes great responsibility” – and this is where things can go wrong.
Kernel code is trusted, by definition, because it can do anything. The Windows kernel is the main part of kernel space, but third-party components may be installed in the kernel, called device drivers. Classic device drivers are required to manage hardware devices – connecting them to the rest of the OS. The fact that you can move your cursor with the mouse, see something on the screen, hear game sounds, etc., means there are device drivers dealing with the hardware correctly, some of which are not written by Microsoft.
If a driver misbehaves, such as causing an exception to occur, the system crashes with the infamous BSOD. This is not some kind of punishment, but a protection mechanism. If a driver misbehaves (or any other kernel component), it is best to stop now, rather than letting the code continue execution which might cause more damage, like data corruption, and even prevent Windows from starting successfully.
Third party drivers are the only entities that Microsoft has no full control over. Drivers must be properly signed, but that only guarantees that they have not been tampered with, as it does not necessarily guarantee quality.
Most Windows systems have some Anti-virus or EDR software protecting them. By default, you get Windows Defender, but there are more powerful EDRs out there, CrowdStrike’s Falcon being one of the leaders in this space.
The “incident” involved a bad update that caused a BSOD when Windows restarted. Restarting again did not help, as a BSOD was showing immediately because of a bug in the driver when it’s loaded and initialized. The only recourse was to boot the system in Safe Mode, where only a minimal set of drivers is loaded, disable the problematic driver, and reboot again. Unfortunately, this has to be done manually on millions of machines.
The Windows kernel treats all kernel components in the same way, regardless of whether that component is from Microsoft or not. Any driver, no matter how insignificant, that causes an unhandled exception, will crash the system with a BSOD. Maybe it would be wise to somehow designate drivers as “important” or “not that important” so they may be treated differently in case of failure. But that is not how Windows works, and in any case, an anti-malware driver is likely to be tagged as “important”.
This entire incident certainly raises questions and concerns – a single point of failure has shown itself in full force. Perhaps a different approach to handling kernel components should be considered.
Personally, I was never comfortable with Windows uniform treatment of kernel components and drivers, but in practice it’s unclear what would be a good way to deal with such exceptions. One alternative is to write drivers in user mode, and many are written in this way, especially to handle relatively slow devices, like USB devices. This works well, but is not good enough for an EDR’s needs.
Perhaps specifically for anti-malware drivers, any unhandled exception should be treated differently by disabling the driver in some way. Not easy to do – the driver has typically registered with the kernel (e.g. PsSetCreateProcessNotifyRoutineExand others), its callbacks may be running right now – how would the kernel “disable” it safely. I don’t think there is a safe way to do that without significant changes in driver protocols. The best one case do (in theory) is issue a BSOD, but disable the offending driver automatically, so that the next restart will work, and a warning can be issued to the user.
This is not ideal, but is certainly better than the alternative experienced in the recent crash. Why is it not ideal? First, the system will be unprotected, unless some default (like Defender) would automatically take over. Second, it’s difficult to determine with 100% certainty that the driver causing the crash is the ultimate culprit. For example, another (buggy) driver may write to anywhere in kernel space, including memory that may belong to our anti-malware driver, and that write operation does not cause an immediate crash since the memory is valid. Later, our driver will stumble upon the bad data and crash. Even so, some kind of mechanism to prevent the widespread crash must be set in place.
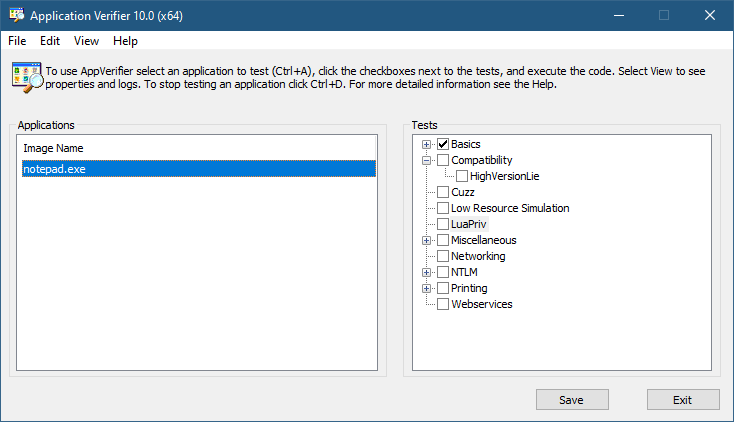
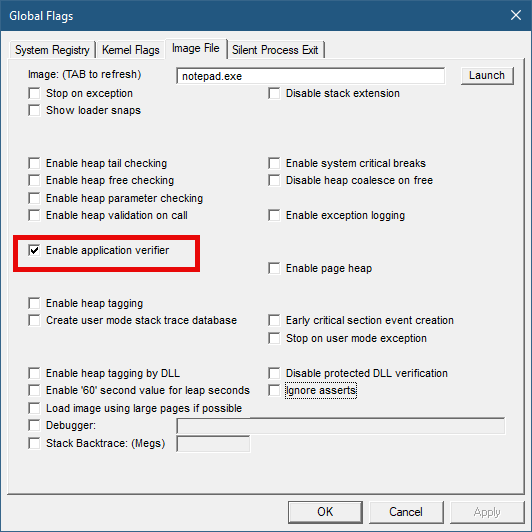
The Application Verifier tool that is part of the Windows SDK provide a way to analyze processes for various types of misbehavior. The GUI provided looks like the following:
Application Verifier application window
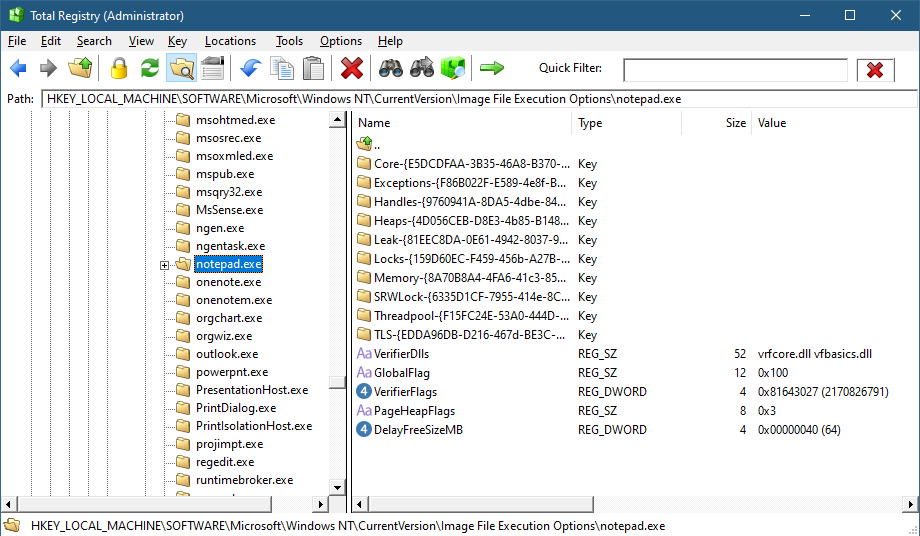
To add an application, you can browse your file system and select an executable. The Application Verifier settings are based around the executable name only – not a full path. This is because verifier settings are stored in a subkey under Image File Execution Options with the name of the executable. For the notepad example above, you’ll find the following in the Registry:
Key for notepad.exe under the IFEO subkey
This IFEO subkey is used for NT Global Flags settings, one of which is using the Application Verifier. The GlobalFlag value is shown to be 0x100, which is the bit used for the verifier. Another way to set it without any extra information is using the GFlags tool, part of the Debugging Tools for Windows package:
GFlags tool
The Application Verifier lists a bunch of DLLs under the VerifierDLLs value. Each one must be located in the system directory (e.g., c:\Windows\System32). Full paths are not supported; this is intentional, because the list of DLLs are going to be loaded to any process running the specified executable, and it would be risky to load DLLs from arbitrary locations in the file system. The system directory, as well as the IFEO key are normally write-accessible by administrators only.
The list of verifier DLLs is selected based on the set of tests selected by the user on the right hand side of the GUI. You’ll find subkeys that are used by the system-provided verifier DLLs with more settings related to the tests selected.
The nice thing about any verifier DLL specified, is that these DLLs are loaded early in the process lifetime, by verifier.dll (in itself loaded by NTDLL.dll), before any other DLLs are loaded into the process. Even attaching a debugger to the process while launching it would “miss” the loading of these DLLs.
This behavior makes this technique attractive for injecting a DLL into arbitrary processes. It’s even possible to enable Application Verifier globally and even dynamically (without the need to restart the system), so that these DLLs are injected into all processes (except protected processes).
Writing a Verifier DLL
Application Verifier tests descriptions is not the focus of this post. Rather, we’ll look into what it takes to create such a DLL that can be injected early and automatically into processes of our choice. As we’ll see, it’s not just about mere injection. The verifier infrastructure (part of verifier.dll) provides convenient facilities to hook functions.
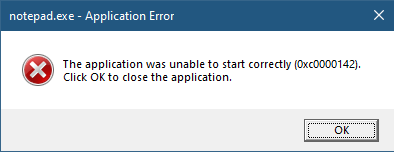
If we create a standard DLL, set up the verifier entries while adding our DLL to the list of verifier DLLs (possibly removing the “standard” ones), and try to run our target executable (say, notepad), we get the following nasty message box:
The process shuts down, which means that if a verifier DLL fails to be properly processed, the process terminates rather than “skipping” the DLL.
Launching notepad with WinDbg spits the following output:
Clearly the DLL did not initialize correctly, which is what the NTSTATUS 0xc0000142 was trying to tell us in the message box.
DLLs are initialized with the DllMain function that typically looks like this:
BOOL WINAPI DllMain(HMODULE hModule, DWORD reason, PVOID lpReserved) {
	switch (reason) {
		case DLL_PROCESS_ATTACH:
		case DLL_THREAD_ATTACH:
		case DLL_THREAD_DETACH:
		case DLL_PROCESS_DETACH:
			break;
	}
	return TRUE;
}
The classic four values shown are used by the DLL to run code when it’s loaded into a process (DLL_PROCESS_ATTACH), unloaded from a process (DLL_PROCESS_DETACH), a thread is created in the process (DLL_THREAD_ATTACH), and thread is exiting in the process (DLL_THREAD_DETACH). It turns out that there is a fifth value, which must be used with verifiier DLLs:
#define DLL_PROCESS_VERIFIER 4
Returning TRUE from such a case is not nearly enough. Instead, a structure expected by the caller of DllMain must be initialized and its address provided in lpReserved. The following structures and callback type definitions are needed:
That’s quite a list. The main structure is RTL_VERIFIER_PROVIDER_DESCRIPTOR that has a pointer to an array of RTL_VERIFIER_DLL_DESCRIPTOR (the last element in the array must end with all zeros), which in itself points to an array of RTL_VERIFIER_THUNK_DESCRIPTOR , used for specifying functions to hook. There are a few callbacks as well. At a minimum, we can define this descriptor like so (no hooking, no special code in callbacks):
This time it works. MyVerify.dll loads right after verifier.dll (which is the one managing verify DLLs).
Hooking Functions
As mentioned before, we can use the verifier engine’s support for hooking functions in arbitrary DLLs. Let’s give this a try by hooking into a couple of functions, GetMessage and CreateFile. First, we need to set up the structures for the hooks on a per-DLL basis:
The second NULL in each triplet is where the original address of the hooked function is stored by the verifier engine. Now we fill the structure with the list of DLLs, pointing to the hook arrays:
The last thing is to actually implement the hooks:
BOOL WINAPI HookGetMessage(PMSG msg, HWND hWnd, UINT filterMin, UINT filterMax) {
	// get original function
	static const auto orgGetMessage = (decltype(::GetMessageW)*)user32Hooks[0].ThunkOldAddress;
	auto result = orgGetMessage(msg, hWnd, filterMin, filterMax);
	char text[128];
	sprintf_s(text, "Received message 0x%X for hWnd 0x%p\n", msg->message, msg->hwnd);
	OutputDebugStringA(text);
	return result;
}

HANDLE WINAPI HookCreateFile(PCWSTR path, DWORD access, DWORD share, LPSECURITY_ATTRIBUTES sa, DWORD cd, DWORD flags, HANDLE hTemplate) {
	// get original function
	static const auto orgCreateFile = (decltype(::CreateFileW)*)kernelbaseHooks[0].ThunkOldAddress;
	auto hFile = orgCreateFile(path, access, share, sa, cd, flags, hTemplate);
	char text[512];
	if (hFile == INVALID_HANDLE_VALUE)
		sprintf_s(text, "Failed to open file %ws (%u)\n", path, ::GetLastError());
	else
		sprintf_s(text, "Opened file %ws successfuly (0x%p)\n", path, hFile);

	OutputDebugStringA(text);
	return hFile;
}
The hooks just send some output with OutputDebugString. Here is an excerpt output when running notepad under a debugger:
ModLoad: 00007ff7`6dfa0000 00007ff7`6dfd8000   notepad.exe
ModLoad: 00007ffd`978f0000 00007ffd`97ae8000   ntdll.dll
ModLoad: 00007ffd`1f650000 00007ffd`1f6c4000   C:\Windows\System32\verifier.dll
Page heap: pid 0xEF18: page heap enabled with flags 0x3.
AVRF: notepad.exe: pid 0xEF18: flags 0x81643027: application verifier enabled
ModLoad: 00007ffd`25b80000 00007ffd`25d24000   C:\Windows\SYSTEM32\MyVerify.dll
ModLoad: 00007ffd`97650000 00007ffd`9770d000   C:\Windows\System32\KERNEL32.dll
ModLoad: 00007ffd`951b0000 00007ffd`954a6000   C:\Windows\System32\KERNELBASE.dll
ModLoad: 00007ffd`963e0000 00007ffd`9640b000   C:\Windows\System32\GDI32.dll
ModLoad: 00007ffd`95790000 00007ffd`957b2000   C:\Windows\System32\win32u.dll
ModLoad: 00007ffd`95090000 00007ffd`951a7000   C:\Windows\System32\gdi32full.dll
...
ModLoad: 00007ffd`964f0000 00007ffd`965bd000   C:\Windows\System32\OLEAUT32.dll
ModLoad: 00007ffd`96d10000 00007ffd`96d65000   C:\Windows\System32\shlwapi.dll
ModLoad: 00007ffd`965d0000 00007ffd`966e4000   C:\Windows\System32\MSCTF.dll
Opened file C:\Windows\Fonts\staticcache.dat successfuly (0x0000000000000164)
ModLoad: 00007ffd`7eac0000 00007ffd`7eb6c000   C:\Windows\System32\TextShaping.dll
ModLoad: 00007ffc`ed750000 00007ffc`ed82e000   C:\Windows\System32\efswrt.dll
ModLoad: 00007ffd`90880000 00007ffd`909d7000   C:\Windows\SYSTEM32\wintypes.dll
ModLoad: 00007ffd`8bf90000 00007ffd`8bfad000   C:\Windows\System32\MPR.dll
ModLoad: 00007ffd`8cae0000 00007ffd`8cce3000   C:\Windows\System32\twinapi.appcore.dll
Opened file C:\Windows\Registration\R000000000025.clb successfuly (0x00000000000001C4)
ModLoad: 00007ffd`823b0000 00007ffd`82416000   C:\Windows\System32\oleacc.dll
...
Received message 0x31F for hWnd 0x00000000001F1776
Received message 0xC17C for hWnd 0x00000000001F1776
Received message 0xF for hWnd 0x00000000001F1776
Received message 0xF for hWnd 0x00000000003010C0
Received message 0xF for hWnd 0x0000000000182E7A
Received message 0x113 for hWnd 0x00000000003319A8
...
ModLoad: 00007ffd`80e20000 00007ffd`80fd4000   C:\Windows\System32\WindowsCodecs.dll
ModLoad: 00007ffd`94ee0000 00007ffd`94f04000   C:\Windows\System32\profapi.dll
Opened file C:\Users\Pavel\AppData\Local\IconCache.db successfuly (0x0000000000000724)
ModLoad: 00007ffd`3e190000 00007ffd`3e1f6000   C:\Windows\System32\thumbcache.dll
Opened file C:\Users\Pavel\AppData\Local\Microsoft\Windows\Explorer\iconcache_idx.db successfuly (0x0000000000000450)
Opened file C:\Users\Pavel\AppData\Local\Microsoft\Windows\Explorer\iconcache_16.db successfuly (0x000000000000065C)
ModLoad: 00007ffd`90280000 00007ffd`90321000   C:\Windows\SYSTEM32\policymanager.dll
This application verifier technique is an interesting one, and fairly easy to use. The full example can be found at https://github.com/zodiacon/VerifierDLL.
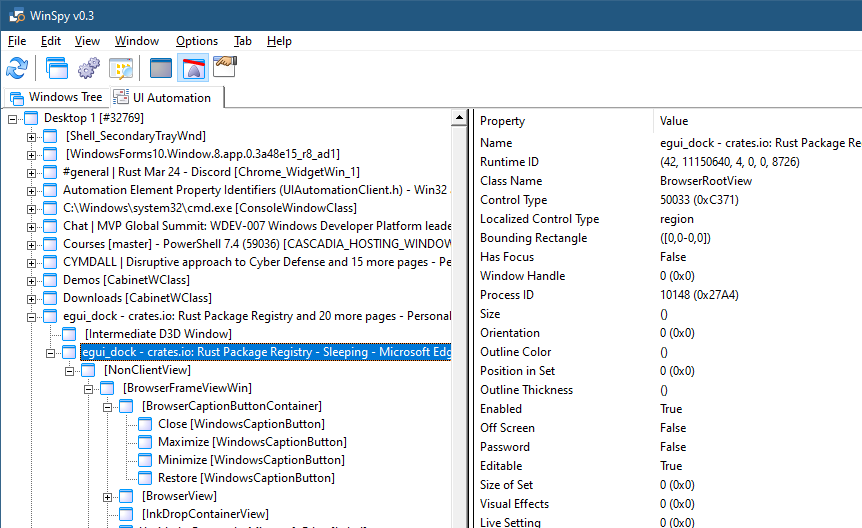
What if you needed to get a list of all the open browser tabs in some browser? In the (very) old days you might assume that each tab is its own window, so you could find a main browser window (using FindWindow, for example), and then enumerate child windows with EnumChildWindowsto locate the tabs. Unfortunately, this approach is destined to fail. Here is a screenshot of WinSpylooking at a main window of Microsoft Edge:
MS Edge showing only two child windows
The title of the main window hints to the existence of 26 tabs, but there are only two child windows and they are not tabs. The inevitable conclusion is that the tabs are not windows at all. They are being “drawn” with some technology that the Win32 windowing infrastructure doesn’t know about nor cares.
How can we get information about those browsing tabs? Enter UI Automation.
UI Automation has been around for many years, starting with the older technology called “Active Accessibility“. This technology is geared towards accessibility while providing rich information that can be consumed by accessibility clients. Although Active Accessibility is still supported for compatibility reasons, a newer technology called UI Automation supersedes it.
UI Automation provides a tree of UI automation elements representing various aspects of a user interface. Some elements represent “true” Win32 windows (have HWND), some represent internal controls like buttons and edit boxes (created with whatever technology), and some elements are virtual (don’t have any graphical aspects), but instead provide “metadata” related to other items.
The UI Automation client API uses COM, where the root object implements the IUIAutomationinterface (it has extended interfaces implemented as well). To get the automation object, the following C++ code can be used (we’ll see a C# example later):
CComPtr<IUIAutomation> spUI;
auto hr = spUI.CoCreateInstance(__uuidof(CUIAutomation));
if (FAILED(hr))
	return Error("Failed to create Automation root", hr);
The client automation interfaces are declared in <UIAutomationClient.h>. The code uses the ATL CComPtr<> smart pointers, but any COM smart or raw pointers will do.
With the UI Automation object pointer in hand, several options are available. One is to enumerate the full or part of the UI element tree. To get started, we can obtain a “walker” object by calling IUIAutomation::get_RawViewWalker. From there, we can start enumerating by calling IUIAutomationTreeWalkerinterface methods, like GetFirstChildElementand GetNextSiblingElement.
Each element, represented by a IUIAutomationElement interface provides a set of properties, some available directly on the interface (e.g. get_CurrentName, get_CurrentClassName, get_CurrentProcessId), while others hide behind a generic method, get_CurrentPropertyValue, where each property has an integer ID, and the result is a VARIANT, to allow for various types of values.
Using this method, the menu item View Automation Tree in WinSpy shows the full automation tree, and you can drill down to any level, while many of the selected element’s properties are shown on the right:
WinSpy automation tree view
If you dig deep enough, you’ll find that MS Edge tabs have a UI automation class name of “EdgeTab”. This is the key to locating browser tabs. (Other browsers may have a different class name). To find tabs, we can enumerate the full tree manually, but fortunately, there is a better way. IUIAutomationElement has a FindAll method that searches for elements based on a set of conditions. The conditions available are pretty flexible – based on some property or properties of elements, which can be combined with And, Or, etc. to get more complex conditions. In our case, we just need one condition – a class name called “EdgeTab”.
First, we’ll create the root object, and the condition (error handling omitted for brevity):
int main() {
	::CoInitialize(nullptr);

	CComPtr<IUIAutomation> spUI;
	auto hr = spUI.CoCreateInstance(__uuidof(CUIAutomation));

	CComPtr<IUIAutomationCondition> spCond;
	CComVariant edgeTab(L"EdgeTab");
	spUI->CreatePropertyCondition(UIA_ClassNamePropertyId, edgeTab, &spCond);
We have a single condition for the class name property, which has an ID defined in the automation headers. Next, we’ll fire off the search from the root element (desktop):
int count = 0;
spTabs->get_Length(&count);
for (int i = 0; i < count; i++) {
	CComPtr<IUIAutomationElement> spTab;
	spTabs->GetElement(i, &spTab);
	CComBSTR name;
	spTab->get_CurrentName(&name);
	int pid;
	spTab->get_CurrentProcessId(&pid);
	printf("%2d PID %6d: %ws\n", i + 1, pid, name.m_str);
}
Try it!
.NET Code
A convenient Nuget package called Interop.UIAutomationClient.Signed provides wrappers for the automation API for .NET clients. Here is the same search done in C# after adding the Nuget package reference:
static void Main(string[] args) {
    const int ClassPropertyId = 30012;
    var ui = new CUIAutomationClass();
    var cond = ui.CreatePropertyCondition(ClassPropertyId, "EdgeTab");
    var tabs = ui.GetRootElement().FindAll(TreeScope.TreeScope_Descendants, cond);
    for (int i = 0; i < tabs.Length; i++) {
        var tab = tabs.GetElement(i);
        Console.WriteLine($"{i + 1,2} PID {tab.CurrentProcessId,6}: {tab.CurrentName}");
    }
}
More Automation
There is a lot more to UI automation – the word “automation” implies some more control. One capability of the API is providing various notifications when certain aspects of elements change. Examples include the IUIAutomation methods AddAutomationEventHandler, AddFocusChangedEventHandler, AddPropertyChangedEventHandler, and AddStructureChangedEventHandler.
More specific information on elements (and some control) is also available with more specific interfaces related to controls, such as IUIAutomationTextPattern, IUIAutomationTextRange, and others.
In the previous post, I’ve shown how to write a minimal, but functional, Projected File System provider using C++. I also semi-promised to write a version of that provider in Rust. I thought we should start small, by implementing a command line tool I wrote years ago called objdir. Its purpose is to be a “command line” version of a simplified WinObj from Sysinternals. It should be able to list objects (name and type) within a given object manager namespace directory. Here are a couple of examples:
Since enumerating object manager directories is required for our ProjFS provider, once we implement objdir in Rust, we’ll have good starting point for implementing the full provider in Rust.
This post assumes you are familiar with the fundamentals of Rust. Even if you’re not, the code should still be fairly understandable, as we’re mostly going to use unsafe rust to do the real work.
Unsafe Rust
One of the main selling points of Rust is its safety – memory and concurrency safety guaranteed at compile time. However, there are cases where access is needed that cannot be checked by the Rust compiler, such as the need to call external C functions, such as OS APIs. Rust allows this by using unsafe blocks or functions. Within unsafe blocks, certain operations are allowed which are normally forbidden; it’s up to the developer to make sure the invariants assumed by Rust are not violated – essentially making sure nothing leaks, or otherwise misused.
The Rust standard library provides some support for calling C functions, mostly in the std::ffi module (FFI=Foreign Function Interface). This is pretty bare bones, providing a C-string class, for example. That’s not rich enough, unfortunately. First, strings in Windows are mostly UTF-16, which is not the same as a classic C string, and not the same as the Rust standard String type. More importantly, any C function that needs to be invoked must be properly exposed as an extern "C" function, using the correct Rust types that provide the same binary representation as the C types.
Doing all this manually is a lot of error-prone, non-trivial, work. It only makes sense for simple and limited sets of functions. In our case, we need to use native APIs, like NtOpenDirectoryObject and NtQueryDirectoryObject. To simplify matters, there are crates available in crates.io (the master Rust crates repository) that already provide such declarations.
Adding Dependencies
Assuming you have Rust installed, open a command window and create a new project named objdir:
cargo new objdir
This will create a subdirectory named objdir, hosting the binary crate created. Now we can open cargo.toml (the manifest) and add dependencies for the following crates:
[dependencies]
ntapi = "0.4"
winapi = { version = "0.3.9", features = [ "impl-default" ] }
winapiprovides most of the Windows API declarations, but does not provide native APIs. ntapiprovides those additional declarations, and in fact depends on winapi for some fundamental types (which we’ll need). The feature “impl-default” indicates we would like the implementations of the standard Rust Default trait provided – we’ll need that later.
The main Function
The main function is going to accept a command line argument to indicate the directory to enumerate. If no parameters are provided, we’ll assume the root directory is requested. Here is one way to get that directory:
let dir = std::env::args().skip(1).next().unwrap_or("\\".to_owned());
(Note that unfortunately the WordPress system I’m using to write this post has no syntax highlighting for Rust, the code might be uglier than expected; I’ve set it to C++).
The argsmethod returns an iterator. We skip the first item (the executable itself), and grab the next one with next. It returns an Option<String>, so we grab the string if there is one, or use a fixed backslash as the string.
Next, we’ll call a helper function, enum_directory that does the heavy lifting and get back a Result where success is a vector of tuples, each containing the object’s name and type (Vec<(String, String)>). Based on the result, we can display the results or report an error:
let result = enum_directory(&dir);
match result {
    Ok(objects) => {
        for (name, typename) in &objects {
            println!("{name} ({typename})");
        }
        println!("{} objects.", objects.len());
    },
    Err(status) => println!("Error: 0x{status:X}")
};
That is it for the main function.
Enumerating Objects
Since we need to use APIs defined within the winapi and ntapi crates, let’s bring them into scope for easier access at the top of the file:
use winapi::shared::ntdef::*;
use ntapi::ntobapi::*;
use ntapi::ntrtl::*;
I’m using the “glob” operator (*) to make it easy to just use the function names directly without any prefix. Why these specific modules? Based on the APIs and types we’re going to need, these are where these are defined (check the documentation for these crates).
enum_directory is where the real is done. Here its declararion:
The function accepts a string slice and returns a Result type, where the Ok variant is a vector of tuples consisting of two standard Rust strings.
The following code follows the basic logic of the EnumDirectoryObjects function from the ProjFS example in the previous post, without the capability of search or filter. We’ll add that when we work on the actual ProjFS project in a future post.
The first thing to do is open the given directory object with NtOpenDirectoryObject. For that we need to prepare an OBJECT_ATTRIBUTES and a UNICODE_STRING. Here is what that looks like:
let mut items = vec![];

unsafe {
    let mut udir = UNICODE_STRING::default();
    let wdir = string_to_wstring(&dir);
    RtlInitUnicodeString(&mut udir, wdir.as_ptr());
    let mut dir_attr = OBJECT_ATTRIBUTES::default();
    InitializeObjectAttributes(&mut dir_attr, &mut udir, OBJ_CASE_INSENSITIVE, NULL, NULL);
We start by creating an empty vector to hold the results. We don’t need any type annotation because later in the code the compiler would have enough information to deduce it on its own. We then start an unsafe block because we’re calling C APIs.
Next, we create a default-initialized UNICODE_STRING and use a helper function to convert a Rust string slice to a UTF-16 string, usable by native APIs. We’ll see this string_to_wstring helper function once we’re done with this one. The returned value is in fact a Vec<u16> – an array of UTF-16 characters.
The next step is to call RtlInitUnicodeString, to initialize the UNICODE_STRING based on the UTF-16 string we just received. Methods such as as_ptr are necessary to make the Rust compiler happy. Finally, we create a default OBJECT_ATTRIBUTES and initialize it with the udir (the UTF-16 directory string). All the types and constants used are provided by the crates we’re using.
The next step is to actually open the directory, which could fail because of insufficient access or a directory that does not exist. In that case, we just return an error. Otherwise, we move to the next step:
let mut hdir: HANDLE = NULL;
match NtOpenDirectoryObject(&mut hdir, DIRECTORY_QUERY, &mut dir_attr) {
    0 => {
        // do real work...
    },
    err => Err(err),
}
The NULL here is just a type alias for the Rust provided C void pointer with a value of zero (*mut c_void). We examine the NTSTATUS returned using a match expression: If it’s not zero (STATUS_SUCCESS), it must be an error and we return an Err object with the status. if it’s zero, we’re good to go. Now comes the real work.
We need to allocate a buffer to receive the object information in this directory and be prepared for the case the information is too big for the allocated buffer, so we may need to loop around to get the next “chunk” of data. This is how the NtQueryDirectoryObject is expected to be used. Let’s allocate a buffer using the standard Vec<> type and prepare some locals:
const LEN: u32 = 1 << 16;
let mut first = 1;
let mut buffer: Vec<u8> = Vec::with_capacity(LEN as usize);
let mut index = 0u32;
let mut size: u32 = 0;
We’re allocating 64KB, but could have chosen any number. Now the loop:
loop {
    let start = index;
    if NtQueryDirectoryObject(hdir, buffer.as_mut_ptr().cast(), LEN, 0, first, &mut index, &mut size) < 0 {
        break;
    }
    first = 0;
    let mut obuffer = buffer.as_ptr() as *const OBJECT_DIRECTORY_INFORMATION;
    for _ in 0..index - start {
        let item = *obuffer;
        let name = String::from_utf16_lossy(std::slice::from_raw_parts(item.Name.Buffer, (item.Name.Length / 2) as usize));
        let typename = String::from_utf16_lossy(std::slice::from_raw_parts(item.TypeName.Buffer, (item.TypeName.Length / 2) as usize));
        items.push((name, typename));
        obuffer = obuffer.add(1);
    }
}
Ok(items)
There are quite a few things going on here. if NtQueryDirectoryObject fails, we break out of the loop. This happens when there are is no more information to give. If there is data, buffer is cast to a OBJECT_DIRECTORY_INFORMATION pointer, and we can loop around on the items that were returned. start is used to keep track of the previous number of items delivered. first is 1 (true) the first time through the loop to force the NtQueryDirectoryObject to start from the beginning.
Once we have an item (item), its two members are extracted. item is of type OBJECT_DIRECTORY_INFORMATION and has two members: Name and TypeName (both UNICODE_STRING). Since we want to return standard Rust strings (which, by the way, are UTF-8 encoded), we must convert the UNICODE_STRINGs to Rust strings. String::from_utf16_lossy performs such a conversion, but we must specify the number of characters, because a UNICODE_STRING does not have to be NULL-terminated. The trick here is std::slice::from_raw_parts that can have a length, which is half of the number of bytes (Length member in UNICODE_STRING).
Finally, Vec<>.push is called to add the tuple (name, typename) to the vector. This is what allows the compiler to infer the vector type. Once we exit the loop, the Ok variant of Result<> is returned with the vector.
The last function used is the helper to convert a Rust string slice to a UTF-16 null-terminated string:
A little-known feature in modern Windows is the ability to expose hierarchical data using the file system. This is called Windows Projected File System (ProjFS), available since Windows 10 version 1809. There is even a sample that exposes the Registry hierarchy using this technology. Using the file system as a “projection” mechanism provides a couple of advantages over a custom mechanism:
Any file viewing tool can present the information such as Explorer, or commands in a terminal.
“Standard” file APIs are used, which are well-known, and available in any programming language or library.
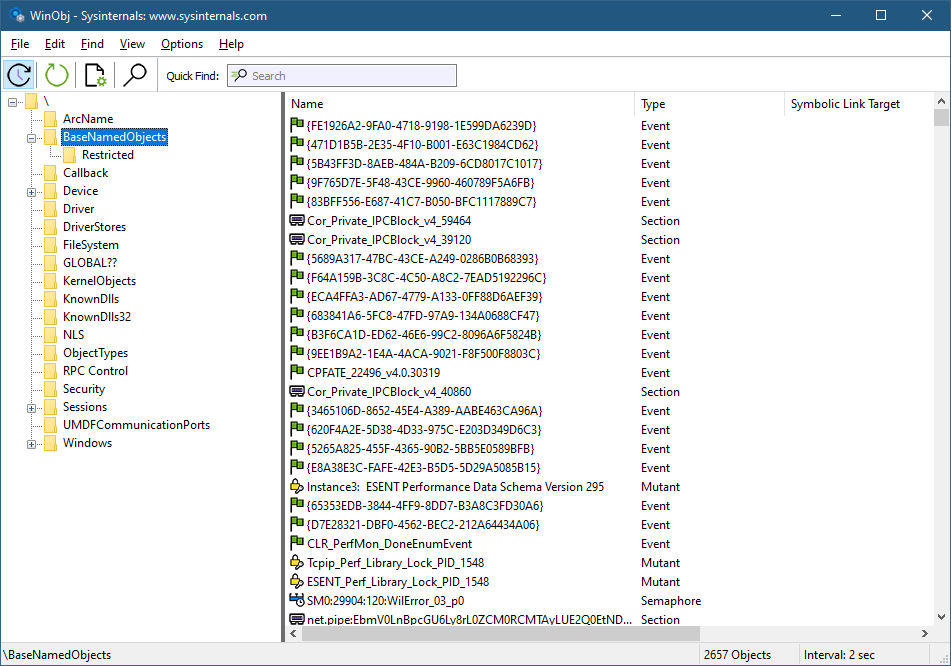
Let’s see how to build a Projected File System provider from scratch. We’ll expose object manager directories as file system directories, and other types of objects as “files”. Normally, we can see the object manager’s namespace with dedicated tools, such as WinObj from Sysinternals, or my own Object Explorer:
WinObj showing parts of the object manager namespace
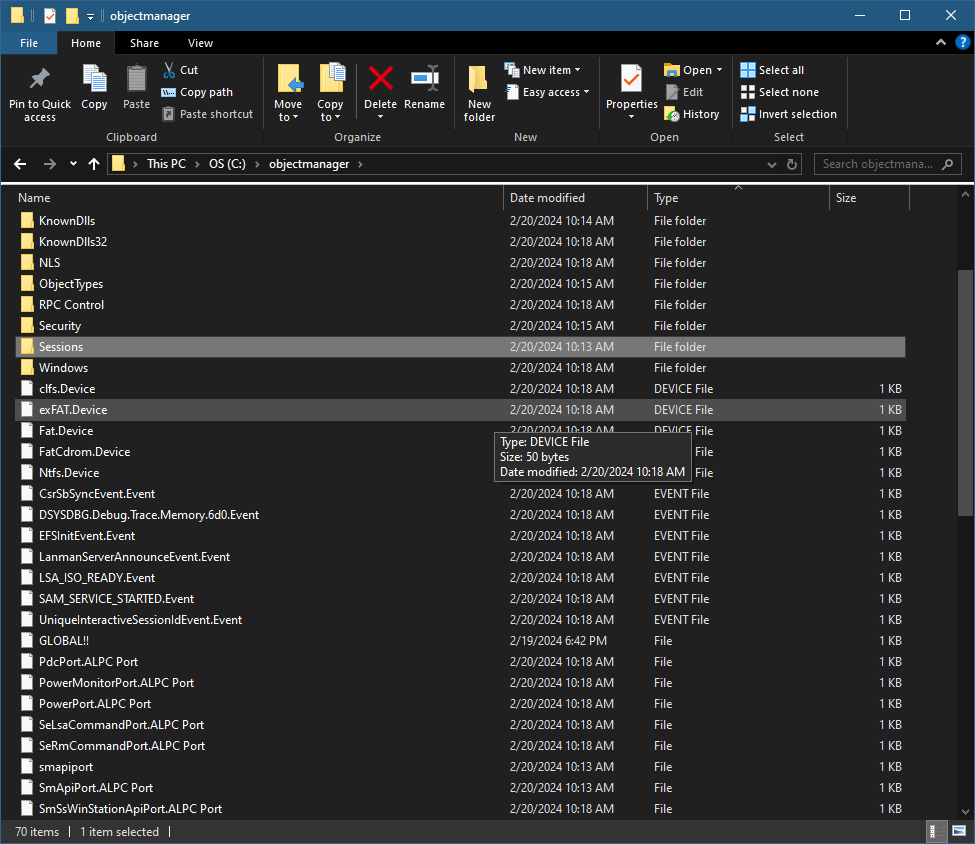
Here is an example of what we are aiming for (viewed with Explorer):
Explorer showing the root of the object manager namespace
First, support for ProjFS must be enabled to be usable. You can enable it with the Windows Features dialog or PowerShell:
projectedfslib.h is where the ProjFS declarations reside. projectedfslib.lib is the import library to link against. In this post, I’ll focus on the main coding aspects, rather than going through every little piece of code. The full code can be found at https://github.com/zodiacon/objmgrprojfs. It’s of course possible to use other languages to implement a ProjFS provider. I’m going to attempt one in Rust in a future post 🙂
The projected file system must be rooted in a folder in the file system. It doesn’t have to be empty, but it makes sense to use such a directory for this purpose only. The main function will take the requested root folder as input and pass it to the ObjectManagerProjection class that is used to manage everything:
int wmain(int argc, const wchar_t* argv[]) {
	if (argc < 2) {
		printf("Usage: ObjMgrProjFS <root_dir>\n");
		return 0;
	}

	ObjectManagerProjection omp;
	if (auto hr = omp.Init(argv[1]); hr != S_OK)
		return Error(hr);

	if (auto hr = omp.Start(); hr != S_OK)
		return Error(hr);

	printf("Virtualizing at %ws. Press ENTER to stop virtualizing...\n", argv[1]);
	char buffer[3];
	gets_s(buffer);

	omp.Term();

	return 0;
}
Let start with the initialization. We want to create the requested directory (if it doesn’t already exist). If it does exist, we’ll use it. In fact, it could exist because of a previous run of the provider, so we can keep track of the instance ID (a GUID) so that the file system itself can use its caching capabilities. We’ll “hide” the GUID in a hidden file within the directory. First, create the directory:
HRESULT ObjectManagerProjection::Init(PCWSTR root) {
	GUID instanceId = GUID_NULL;
	std::wstring instanceFile(root);
	instanceFile += L"\\_obgmgrproj.guid";

	if (!::CreateDirectory(root, nullptr)) {
		//
		// failed, does it exist?
		//
		if (::GetLastError() != ERROR_ALREADY_EXISTS)
			return HRESULT_FROM_WIN32(::GetLastError());
If creation fails not because it exists, bail out with an error. Otherwise, get the instance ID that may be there and use that GUID if present:
If we need to generate a new GUID, we’ll do that with CoCreateGuid and write it to the hidden file:
if (instanceId == GUID_NULL) {
	::CoCreateGuid(&instanceId);
	//
	// write instance ID
	//
	auto hFile = ::CreateFile(instanceFile.c_str(), GENERIC_WRITE, 0, nullptr, CREATE_NEW, FILE_ATTRIBUTE_HIDDEN, nullptr);
	if (hFile != INVALID_HANDLE_VALUE) {
		DWORD ret;
		::WriteFile(hFile, &instanceId, sizeof(instanceId), &ret, nullptr);
		::CloseHandle(hFile);
	}
}
Finally, we must register the root with ProjFS:
auto hr = ::PrjMarkDirectoryAsPlaceholder(root, nullptr, nullptr, &instanceId);
if (FAILED(hr))
	return hr;

m_RootDir = root;
return hr;
Once Init succeeds, we need to start the actual virtualization. To that end, a structure of callbacks must be filled so that ProjFS knows what functions to call to get the information requested by the file system. This is the job of the Start method:
The callbacks specified above are the absolute minimum required for a valid provider. PrjStartVirtualizing returns a virtualization context that identifies our provider, which we need to use (at least) when stopping virtualization. It’s a blocking call, which is convenient in a console app, but for other cases, it’s best put in a separate thread. The this value passed in is a user-defined context. We’ll use that to delegate these static callback functions to member functions. Here is the code for StartDirectoryEnumerationCallback:
The same trick is used for the other callbacks, so that we can implement the functionality within our class. The class ObjectManagerProjection itself holds on to the following data members of interest:
EnumInfo is a structure used to keep an object directory’s contents and the current index requested by the file system. A map is used to keep track of all current enumerations. Remember, it’s the file system – multiple directory listings may be happening at the same time. As it happens, each one is identified by a GUID, which is why it’s used as a key to the map. m_VirtContext is the returned value from PrjStartVirtualizing.
ObjectNameAndType is a little structure that stores the details of an object: its name and type:
Obviously, the bulk work for the provider is centered in the callbacks. Let’s start with StartDirectoryEnumerationCallback. Its purpose is to let the provider know that a new directory enumeration of some sort is beginning. The provider can make any necessary preparations. In our case, it’s about adding a new enumeration structure to manage based on the provided enumeration GUID:
We just add a new entry to our map, since we must be able to distinguish between multiple enumerations that may be happening concurrently. The complementary callback ends an enumeration which is where we delete the item from the map:
So far, so good. The real work is centered around the GetDirectoryEnumerationCallback callback where actual enumeration must take place. The callback receives the enumeration ID and a search expression – the client may try to search using functions such as FindFirstFile / FindNextFile or similar APIs. The provided PRJ_CALLBACK_DATA contains the basic details of the request such as the relative directory itself (which could be a subdirectory). First, we reject any unknown enumeration IDs:
HRESULT ObjectManagerProjection::DoGetDirectoryEnumerationCallback(
	const PRJ_CALLBACK_DATA* callbackData, const GUID* enumerationId,
	PCWSTR searchExpression, PRJ_DIR_ENTRY_BUFFER_HANDLE dirEntryBufferHandle) {

	auto it = m_Enumerations.find(*enumerationId);
	if(it == m_Enumerations.end())
		return E_INVALIDARG;
    auto& info = it->second;
Next, we need to enumerate the objects in the provided directory, taking into consideration the search expression (that may require returning a subset of the items):
There are quite a few things happening here. ObjectManager::EnumDirectoryObjects is a helper function that does the actual enumeration of objects in the object manager’s namespace given the root directory (callbackData->FilePathName), which is always relative to the virtualization root, which is convenient – we don’t need to care where the actual root is. The compare lambda is passed to EnumDirectoryObjects to provide a filter based on the search expression. ProjFS provides the PrjFileNameMatch function we can use to test if a specific name should be returned or not. It has the logic that caters for wildcards like * and ?.
Once the results return in a vector (info.Objects), we must sort it. The file system expects returned files/directories to be sorted in a case insensitive way, but we don’t actually need to know that. PrjFileNameCompare is provided as a function to use for sorting purposes. We call sort on the returned vector passing this function PrjFileNameCompare as the compare function.
The enumeration must happen if the PRJ_CB_DATA_FLAG_ENUM_RESTART_SCAN is specified. I also enumerate if it’s the first call for this enumeration ID.
Now that we have results (or an empty vector), we can proceed by telling ProjFS about the results. If we have no results, just return success (an empty directory):
if (info.Objects.empty())
	return S_OK;
Otherwise, we must call PrjFillDirEntryBuffer for each entry in the results. However, ProjFS provides a limited buffer to accept data, which means we need to keep track of where we left off because we may be called again (without the PRJ_CB_DATA_FLAG_ENUM_RESTART_SCAN flag) to continue filling in data. This is why we keep track of the index we need to use.
The first step in the loop is to fill in details of the item: is it a subdirectory or a “file”? We can also specify the size of its data and common times like creation time, modify time, etc.:
We fill in two details: a directory or not, based on the kernel object type being “Directory”, and a file size (in case of another type object). What is the meaning of a “file size”? It can mean whatever we want it to mean, including just specifying a size of zero. However, I decided that the “data” being held in an object would be text that provides the object’s name, type, and target (if it’s a symbolic link). Here are a few example when running the provider and using a command window:
C:\objectmanager>dir p* Volume in drive C is OS Volume Serial Number is 18CF-552E
Directory of C:\objectmanager
02/20/2024 11:09 AM 60 PdcPort.ALPC Port 02/20/2024 11:09 AM 76 PendingRenameMutex.Mutant 02/20/2024 11:09 AM 78 PowerMonitorPort.ALPC Port 02/20/2024 11:09 AM 64 PowerPort.ALPC Port 02/20/2024 11:09 AM 88 PrjFltPort.FilterConnectionPort 5 File(s) 366 bytes 0 Dir(s) 518,890,110,976 bytes free
What is the meaning of the various times and file attributes? It can mean whatever you want – it might make sense for some types of data. If left at zero, the current time is used.
GetObjectSize is a helper function that calculates the number of bytes needed to keep the object’s text, which is what is reported to the file system.
Now we can pass the information for the item to ProjFS by calling PrjFillDirEntryBuffer:
The “name” of the item is comprised of the kernel object’s name, and the “file extension” is the object’s type name. This is just a matter of choice – I could have passed the object’s name only so that it would appear as a file with no extension. If the call to PrjFillDirEntryBuffer fails, it means the buffer is full, so we break out, but the index is not incremented, so we can provide the next object in the next callback that does not requires a rescan.
We have two callbacks remaining. One is GetPlaceholderInformationCallback, whose purpose is to provide “placeholder” information about an item, without providing its data. This is used by the file system for caching purposes. The implementation is like so:
HRESULT ObjectManagerProjection::DoGetPlaceholderInformationCallback(const PRJ_CALLBACK_DATA* callbackData) {
	auto path = callbackData->FilePathName;
	auto dir = ObjectManager::DirectoryExists(path);
	std::optional<ObjectNameAndType> object;
	if (!dir)
		object = ObjectManager::ObjectExists(path);
	if(!dir && !object)
		return HRESULT_FROM_WIN32(ERROR_FILE_NOT_FOUND);

	PRJ_PLACEHOLDER_INFO info{};
	info.FileBasicInfo.IsDirectory = dir;
	info.FileBasicInfo.FileSize = dir ? 0 : GetObjectSize(path, object.value());
	return PrjWritePlaceholderInfo(m_VirtContext, callbackData->FilePathName, &info, sizeof(info));
}
The item could be a file or a directory. We use the file path name provided to figure out if it’s a directory kernel object or something else by utilizing some helpers in the ObjectManager class (we’ll examine those later). Then the structure PRJ_PLACEHOLDER_INFO is filled with the details and provided to PrjWritePlaceholderInfo.
The final required callback is the one that provides the data for files – objects in our case:
HRESULT ObjectManagerProjection::DoGetFileDataCallback(const PRJ_CALLBACK_DATA* callbackData, UINT64 byteOffset, UINT32 length) {
	auto object = ObjectManager::ObjectExists(callbackData->FilePathName);
	if (!object)
		return HRESULT_FROM_WIN32(ERROR_FILE_NOT_FOUND);

	auto buffer = ::PrjAllocateAlignedBuffer(m_VirtContext, length);
	if (!buffer)
		return E_OUTOFMEMORY;

	auto data = GetObjectData(callbackData->FilePathName, object.value());
	memcpy(buffer, (PBYTE)data.c_str() + byteOffset, length);
	auto hr = ::PrjWriteFileData(m_VirtContext, &callbackData->DataStreamId, buffer, byteOffset, length);
	::PrjFreeAlignedBuffer(buffer);

	return hr;
}
First we check if the object’s path is valid. Next, we need to allocate buffer for the data. There are some ProjFS alignment requirements, so we call PrjAllocateAlignedBuffer to allocate a properly-aligned buffer. Then we get the object data (a string, by calling our helper GetObjectData), and copy it into the allocated buffer. Finally, we pass the buffer to PrjWriteFileData and free the buffer. The byte offset provided is usually zero, but could theoretically be larger if the client reads from a non-zero position, so we must be prepared for it. In our case, the data is small, but in general it could be arbitrarily large.
GetObjectData itself looks like this:
std::wstring ObjectManagerProjection::GetObjectData(PCWSTR fullname, ObjectNameAndType const& info) {
	std::wstring target;
	if (info.TypeName == L"SymbolicLink") {
		target = ObjectManager::GetSymbolicLinkTarget(fullname);
	}
	auto result = std::format(L"Name: {}\nType: {}\n", info.Name, info.TypeName);
	if (!target.empty())
		result = std::format(L"{}Target: {}\n", result, target);
	return result;
}
It calls a helper function, ObjectManager::GetSymbolicLinkTarget in case of a symbolic link, and builds the final string by using format (C++ 20) before returning it to the caller.
That’s all for the provider, except when terminating:
Looking into the ObjectManager helper class is somewhat out of the focus of this post, since it has nothing to do with ProjFS. It uses native APIs to enumerate objects in the object manager’s namespace and get details of a symbolic link’s target. For more information about the native APIs, check out my book “Windows Native API Programming” or search online. First, it includes <Winternl.h> to get some basic native functions like RtlInitUnicodeString, and also adds the APIs for directory objects:
Here is the main code that enumerates directory objects (some details omitted for clarity, see the full source code in the Github repo):
std::vector<ObjectNameAndType> ObjectManager::EnumDirectoryObjects(PCWSTR path,
	PCWSTR objectName, std::function<bool(PCWSTR)> compare) {
	std::vector<ObjectNameAndType> objects;
	HANDLE hDirectory;
	OBJECT_ATTRIBUTES attr;
	UNICODE_STRING name;
	std::wstring spath(path);
	if (spath[0] != L'\\')
		spath = L'\\' + spath;

	std::wstring object(objectName ? objectName : L"");

	RtlInitUnicodeString(&name, spath.c_str());
	InitializeObjectAttributes(&attr, &name, 0, nullptr, nullptr);
	if (!NT_SUCCESS(NtOpenDirectoryObject(&hDirectory, DIRECTORY_QUERY, &attr)))
		return objects;

	objects.reserve(128);
	BYTE buffer[1 << 12];
	auto info = reinterpret_cast<OBJECT_DIRECTORY_INFORMATION*>(buffer);
	bool first = true;
	ULONG size, index = 0;
	for (;;) {
		auto start = index;
		if (!NT_SUCCESS(NtQueryDirectoryObject(hDirectory, info, sizeof(buffer), FALSE, first, &index, &size)))
			break;
		first = false;
		for (ULONG i = 0; i < index - start; i++) {
			ObjectNameAndType data;
			auto& p = info[i];
			data.Name = std::wstring(p.Name.Buffer, p.Name.Length / sizeof(WCHAR));
			if(compare && !compare(data.Name.c_str()))
				continue;
			data.TypeName = std::wstring(p.TypeName.Buffer, p.TypeName.Length / sizeof(WCHAR));
			if(!objectName)
				objects.push_back(std::move(data));
			if (objectName && _wcsicmp(object.c_str(), data.Name.c_str()) == 0 ||
				_wcsicmp(object.c_str(), (data.Name + L"." + data.TypeName).c_str()) == 0) {
				objects.push_back(std::move(data));
				break;
			}
		}
	}
	::CloseHandle(hDirectory);
	return objects;
}
NtQueryDirectoryObject is called in a loop with increasing indices until it fails. The returned details for each entry is the object’s name and type name.
The example provided is the bare minimum needed to write a ProjFS provider. This could be interesting for various types of data that is convenient to access with I/O APIs. Feel free to extend the example and resolve any bugs.
Unless you’ve been living under a rock for the past several years (and you are a software developer), the Rust programming language is hard to ignore – in fact, it’s been voted as the “most loved” language for several years (whatever that means). Rust provides the power and performance of C++ with full memory and concurrency safety. It’s a system programming languages, but has high-level features like functional programming style and modularity. That said, Rust has a relatively steep learning curve compared to other mainstream languages.
I’m happy to announce a new training class – Rust Programming Masterclass. This is a brand new, 4 day class, split into 8 half-days, that covers all the foundational pieces of Rust. Here is the list of modules:
Module 1: Introduction to Rust
Module 2: Language Fundamentals
Module 3: Ownership
Module 4: Compound Types
Module 5: Common Types and Collections
Module 6: Modules and Project Management
Module 7: Error Handling
Module 8: Generics and Traits
Module 9: Smart Pointers
Module 10: Functional Programming
Module 11: Threads and Concurrency
Module 12: Async and Await
Module 13: Unsafe Rust and Interoperability
Module 14: Macros
Module 15: Lifetimes
Dates are listed below. The times are 11am-3pm EST (8am-12pm PST) (4pm-8pm UT) March: 25, 27, 29, April: 1, 3, 5, 8, 10.
Cost: 850 USD (if paid by an individual), 1500 USD if paid by a company. Previous students in my classes get 10% off.
Special bonus for this course: anyone registering gets a 50% discount to any two courses at https://training.trainsec.net.
Registration
If you’d like to register, please send me an email to zodiacon@live.com and provide your full name, company (if any), preferred contact email, and your time zone.
The sessions will be recorded, so you can watch any part you may be missing, or that may be somewhat overwhelming in “real time”.
As usual, if you have any questions, feel free to send me an email, or DM on X (twitter) or Linkedin.
I promised this class a while back, and now it is happening. This is a brand new, 3 day class, split into 6 half-days, that covers the x64 processor architecture, programming in general, and programming in the context of Windows. The syllabus can be found here. It may change a bit, but should mostly be stable.
Dates are listed below. The times are 12pm-4pm EST (9am-1pm PST) (5pm-9pm UT) January: 15, 17, 22, 24, 29, 31.
Cost: 750 USD (if paid by an individual), 1400 USD if paid by a company.
Registration
If you’d like to register, please send me an email to zodiacon@live.com and provide your full name, company (if any), preferred contact email, and your time zone. Previous participants in my classes get 10% off.
The sessions will be recorded, so you can watch any part you may be missing, or that may be somewhat overwhelming in “real time”.
As usual, if you have any questions, feel free to send me an email, or DM on X (twitter) or Linkedin.
It’s been a while since I have taught a public class. I am happy to launch a new class that combines Windows Kernel Programming and Advanced Windows Kernel Programming into a 6-day (48 hours) masterclass. The full syllabus can be found here.
For those who have attended the Windows Kernel Programming class, and wish to capture the more “advanced” stuff, I offer one of two options:
Join the second part (3 days) of the training, at 60% of the entire course cost.
Register for the entire course with a 20% discount, and get the free recorded course.
The course is planned to stretch from mid-December to late-January, in 4-hour chunks to make it easier to combine with other activities and also have the time to do lab exercises (very important for truly understanding the material). Yes, I know christmas is in the middle there, I’ll keep the last week of December free 🙂
The course will be conducted remotely using MS Teams or similar.
Dates and times (not final, but unlikely to change much, if at all):
Dec 2023: 12, 14, 19, 21: 12pm-4pm EST (9am-1pm PST)
Jan 2024: 2, 4, 9, 11, 16, 18, 23, 25: 12pm-4pm EST (9am-1pm PST)
Training cost:
Early bird (until Nov 22): 1150 USD
After Nov 22: 1450 USD
If you’d like to register, please write to zodiacon@live.com with your name, company name (if any), and time zone. If you have any question, use the same email or DM me on X (Twitter) or Linkedin.
Many developers and researcher are faimilar with the SetWindowsHookExAPI that provides ways to intercept certain operations related to user interface, such as messages targetting windows. Most of these hooks can be set on a specific thread, or all threads attached to the current desktop. A short video showing how to use this API can be found here. One of the options is to inject a DLL to the target process(es) that is invoked inline to process the relevant events.
There is another mechanism, less known, that provides various events that relate to UI, that can similarly be processed by a callback. This can be attached to a specific thread or process, or to all processes that have threads attached to the current desktop. The API in question is SetWinEventHook:
The function allows invoking a callback (pfnWinEventProc) when an event occurs. eventMin and eventMax provide a simple way to filter events. If all events are needed, EVENT_MIN and EVENT_MAX can be used to cover every possible event. The module is needed if the function is inside a DLL, so that hmodWinEventProc is the module handle loaded into the calling process. The DLL will automatically be loaded into target process(es) as needed, very similar to the way SetWindowsHookEx works.
idProcess and idThread allow targetting a specific thread, a specific process, or all processes in the current desktop (if both IDs are zero). Targetting all processes is possible even without a DLL. In that case, the event information is marshalled back to the caller’s process and invoked there. This does require to pass the WINEVENT_OUTOFCONTEXT flag to indicate this requirement. The following example shows how to install such event monitoring for all processes/threads in the current desktop:
The last two flags indicate that events from the caller’s process should not be reported. Notice the weird-looking GetMessage call – it’s required for the event handler to be called. The weird part is that a MSG structure is not needed, contrary to the function’s SAL that requires a non-NULL pointer.
The event handler itself can do anything, however, the information provided is fundamentally different than SetWindowsHookEx callbacks. For example, there is no way to “change” anything – it’s just notifying about things that already happended. These events are related to accessibility and are not directly related to windows messaging. Here is the event handler prototype:
void CALLBACK OnEvent(HWINEVENTHOOK hWinEventHook, DWORD event,
    HWND hwnd, LONG idObject, LONG idChild, DWORD eventTid, DWORD time);
event is the event being reported. Various such events are defined in WinUser.h and there are many values that can be used by third paries and OEMs. It’s worthwile checking the header file because every Microsoft-defined event has details as to when such an event is raised, and the meaning of idObject, idChild and hwnd for that event. eventTid is the thread ID from which the event originated. hwnd is typically the window or constrol associated with the event (if any) – some events are general enough so that no hwnd is provided.
We can get more information on the object that is associated with the event by tapping into the accessibility API. Accessibility objects implement the IAccessibleCOM interface at least, but may implement other interfaces as well. To get an IAccesible pointer from an event handler, we can use AccessibleObjectFromEvent:
I’ve included <atlbase.h> to get the ATL client side support (smart pointers and COM type wrappers). Other APIs that can bring an IAccessible in other contexts include AccessibleObjectFromPointand AccessibleObjectFromWindow.
Note that you must also include <oleacc.h> and link with oleacc.lib.
IAccessible has quite a few methods and properties, the simplest of which is Name that is mandatory for implementors to provide:
Refer to the documentation for other members of IAccessible. We can also get the details of the process associated with the event by going through the window handle or the thread ID and retrieving the executable name. Here is an example with a window handle:
GetWindowThreadProcessIdretrieves the process ID (and thread ID) associated with a window handle. We could go with the given thread ID – call OpenThread and then GetProcessIdOfThread. The interested reader is welcome to try this approach to retrieve the process ID. Here is the full event handler for this example dumping all using printf:
EventNameToString is a little helper converting some event IDs to names. If you run this code (SimpleWinEventHook project), you’ll see lots of output, because one of the reported events is EVENT_OBJECT_LOCATIONCHANGE that is raised (among other reasons) when the mouse cursor position changes:
Instead of getting events on the SetWinEventHook caller’s thread, a DLL can be injected. Such a DLL must export the event handler so that the process setting up the handler can locate the function with GetProcAddress.
As an example, I created a simple DLL that implements the event handler similarly to the previous example (without the process name) like so:
Note the function is exported. The code uses printf, but there is no guarantee that a target process has a console to use. The DllMain function creates such a console and attached the standard output handle to it (otherwise printf wouldn’t have an output handle, since the process wasn’t bootstraped with a console):
HANDLE hConsole;

BOOL APIENTRY DllMain(HMODULE hModule, DWORD reason, PVOID lpReserved) {
	switch (reason) {
		case DLL_PROCESS_DETACH:
			if (hConsole)   // be nice
				::CloseHandle(hConsole);
			break;

		case DLL_PROCESS_ATTACH:
			if (::AllocConsole()) {
				auto hConsole = ::CreateFile(L"CONOUT$", GENERIC_WRITE,
                    0, nullptr, OPEN_EXISTING, 0, nullptr);
				if (hConsole == INVALID_HANDLE_VALUE)
					return FALSE;
				::SetStdHandle(STD_OUTPUT_HANDLE, hConsole);
			}
			break;
	}
	return TRUE;
}
The injector process (WinHookInject project) first grabs a target process ID (if any):
int main(int argc, const char* argv[]) {
	DWORD pid = argc < 2 ? 0 : atoi(argv[1]);
	if (pid == 0) {
		printf("Warning: injecting to potentially processes with threads connected to the current desktop.\n");
		printf("Continue? (y/n) ");
		char ans[3];
		gets_s(ans);
		if (tolower(ans[0]) != 'y')
			return 0;
	}
The warning is shown of no PID is provided, because creating consoles for certain processes could wreak havoc. If you do want to inject a DLL to all processes on the desktop, avoid creating consoles.
Once we have a target process (or not), we need to load the DLL (hardcoded for simplicity) and grab the exported event handler function:
auto hLib = ::LoadLibrary(L"Injected.Dll");
if (!hLib) {
	printf("DLL not found!\n");
	return 1;
}
auto OnEvent = (WINEVENTPROC)::GetProcAddress(hLib, "OnEvent");
if (!OnEvent) {
	printf("Event handler not found!\n");
	return 1;
}
The final step is to register the handler. If you’re targetting all processes, you’re better off limiting the events you’re interested in, especially the noisy ones. If you just want a DLL injected and you don’t care about any events, select a range that has no events and then call a relevant function to force the DLL to be loaded into the target process(es). I’ll let the interested reader figure these things out.
Note the arguments include the DLL module, the handler address, and the flag WINEVENT_INCONTEXT. Here is some output when using this DLL on a Notepad instance. A console is created the first time Notepad causes an event to be raised: