Levels of Kernel Debugging

Doing any kind of research into the Windows kernel requires working with a kernel debugger, mostly WinDbg (or WinDbg Preview). There are at least 3 “levels” of debugging the kernel.

Level 1: Local Kernel Debugging

The first is using a local kernel debugger, which means configuring WinDbg to look at the kernel of the local machine. This can be configured by running the following command in an elevated command window, and restarting the system:

bcdedit -debug on

You must disable Secure Boot (if enabled) for this command to work, as Secure Boot protects against putting the machine in local kernel debugging mode. Once the system is restarted, WinDbg launched elevated, select File/Kernel Debug and go with the “Local” option (WinDbg Preview shown):

If all goes well, you’ll see the “lkd>” prompt appearing, confirming you’re in local kernel debugging mode.

What can you in this mode? You can look at anything in kernel and user space, such as listing the currently existing processes (!process 0 0), or examining any memory location in kernel or user space. You can even change kernel memory if you so desire, but be careful, any “bad” change may crash your system.

The downside of local kernel debugging is that the system is a moving target, things change while you’re typing commands, so you don’t want to look at things that change quickly. Additionally, you cannot set any breakpoint; you cannot view any CPU registers, since these are changing constantly, and are on a CPU-basis anyway.

The upside of local kernel debugging is convenience – setting it up is very easy, and you can still get a lot of information with this mode.

Level 2: Remote Debugging of a Virtual Machine

The next level is a full kernel debugging experience of a virtual machine, which can be running locally on your host machine, or perhaps on another host somewhere. Setting this up is more involved. First, the target VM must be set up to allow kernel debugging and set the “interface” to the host debugger. Windows supports several interfaces, but for a VM the best to use is network (supported on Windows 8 and later).

First, go to the VM and ping the host to find out its IP address. Then type the following:

bcdedit /dbgsettings net hostip:172.17.32.1 port:55000 key:1.2.3.4

Replace the host IP with the correct address, and select an unused port on the host. The key can be left out, in which case the command will generate something for you. Since that key is needed on the host side, it’s easier to select something simple. If the target VM is not local, you might prefer to let the command generate a random key and use that.

Next, launch WinDbg elevated on the host, and attach to the kernel using the “Net” option, specifying the correct port and key:

Restart the target, and it should connect early in its boot process:

Microsoft (R) Windows Debugger Version 10.0.25200.1003 AMD64
Copyright (c) Microsoft Corporation. All rights reserved.

Using NET for debugging
Opened WinSock 2.0
Waiting to reconnect...
Connected to target 172.29.184.23 on port 55000 on local IP 172.29.176.1.
You can get the target MAC address by running .kdtargetmac command.
Connected to Windows 10 25309 x64 target at (Tue Mar  7 11:38:18.626 2023 (UTC - 5:00)), ptr64 TRUE
Kernel Debugger connection established.  (Initial Breakpoint requested)

************* Path validation summary **************
Response                         Time (ms)     Location
Deferred                                       SRV*d:\Symbols*https://msdl.microsoft.com/download/symbols
Symbol search path is: SRV*d:\Symbols*https://msdl.microsoft.com/download/symbols
Executable search path is: 
Windows 10 Kernel Version 25309 MP (1 procs) Free x64
Edition build lab: 25309.1000.amd64fre.rs_prerelease.230224-1334
Machine Name:
Kernel base = 0xfffff801`38600000 PsLoadedModuleList = 0xfffff801`39413d70
System Uptime: 0 days 0:00:00.382
nt!DebugService2+0x5:
fffff801`38a18655 cc              int     3

Enter the g command to let the system continue. The prompt is “kd>” with the current CPU number on the left. You can break at any point into the target by clicking the “Break” toolbar button in the debugger. Then you can set up breakpoints, for whatever you’re researching. For example:

1: kd> bp nt!ntWriteFile
1: kd> g
Breakpoint 0 hit
nt!NtWriteFile:
fffff801`38dccf60 4c8bdc          mov     r11,rsp
2: kd> k
 # Child-SP          RetAddr               Call Site
00 fffffa03`baa17428 fffff801`38a81b05     nt!NtWriteFile
01 fffffa03`baa17430 00007ff9`1184f994     nt!KiSystemServiceCopyEnd+0x25
02 00000095`c2a7f668 00007ff9`0ec89268     0x00007ff9`1184f994
03 00000095`c2a7f670 0000024b`ffffffff     0x00007ff9`0ec89268
04 00000095`c2a7f678 00000095`c2a7f680     0x0000024b`ffffffff
05 00000095`c2a7f680 0000024b`00000001     0x00000095`c2a7f680
06 00000095`c2a7f688 00000000`000001a8     0x0000024b`00000001
07 00000095`c2a7f690 00000095`c2a7f738     0x1a8
08 00000095`c2a7f698 0000024b`af215dc0     0x00000095`c2a7f738
09 00000095`c2a7f6a0 0000024b`0000002c     0x0000024b`af215dc0
0a 00000095`c2a7f6a8 00000095`c2a7f700     0x0000024b`0000002c
0b 00000095`c2a7f6b0 00000000`00000000     0x00000095`c2a7f700
2: kd> .reload /user
Loading User Symbols
.....................
2: kd> k
 # Child-SP          RetAddr               Call Site
00 fffffa03`baa17428 fffff801`38a81b05     nt!NtWriteFile
01 fffffa03`baa17430 00007ff9`1184f994     nt!KiSystemServiceCopyEnd+0x25
02 00000095`c2a7f668 00007ff9`0ec89268     ntdll!NtWriteFile+0x14
03 00000095`c2a7f670 00007ff9`08458dda     KERNELBASE!WriteFile+0x108
04 00000095`c2a7f6e0 00007ff9`084591e6     icsvc!ICTransport::PerformIoOperation+0x13e
05 00000095`c2a7f7b0 00007ff9`08457848     icsvc!ICTransport::Write+0x26
06 00000095`c2a7f800 00007ff9`08452ea3     icsvc!ICEndpoint::MsgTransactRespond+0x1f8
07 00000095`c2a7f8b0 00007ff9`08452abc     icsvc!ICTimeSyncReferenceMsgHandler+0x3cb
08 00000095`c2a7faf0 00007ff9`084572cf     icsvc!ICTimeSyncMsgHandler+0x3c
09 00000095`c2a7fb20 00007ff9`08457044     icsvc!ICEndpoint::HandleMsg+0x11b
0a 00000095`c2a7fbb0 00007ff9`084574c1     icsvc!ICEndpoint::DispatchBuffer+0x174
0b 00000095`c2a7fc60 00007ff9`08457149     icsvc!ICEndpoint::MsgDispatch+0x91
0c 00000095`c2a7fcd0 00007ff9`0f0344eb     icsvc!ICEndpoint::DispatchThreadFunc+0x9
0d 00000095`c2a7fd00 00007ff9`0f54292d     ucrtbase!thread_start<unsigned int (__cdecl*)(void *),1>+0x3b
0e 00000095`c2a7fd30 00007ff9`117fef48     KERNEL32!BaseThreadInitThunk+0x1d
0f 00000095`c2a7fd60 00000000`00000000     ntdll!RtlUserThreadStart+0x28
2: kd> !process -1 0
PROCESS ffffc706a12df080
    SessionId: 0  Cid: 0828    Peb: 95c27a1000  ParentCid: 044c
    DirBase: 1c57f1000  ObjectTable: ffffa50dfb92c880  HandleCount: 123.
    Image: svchost.exe

In this “level” of debugging you have full control of the system. When in a breakpoint, nothing is moving. You can view register values, call stacks, etc., without anything changing “under your feet”. This seems perfect, so do we really need another level?

Some aspects of a typical kernel might not show up when debugging a VM. For example, looking at the list of interrupt service routines (ISRs) with the !idt command on my Hyper-V VM shows something like the following (truncated):

2: kd> !idt

Dumping IDT: ffffdd8179e5f000

00:	fffff80138a79800 nt!KiDivideErrorFault
01:	fffff80138a79b40 nt!KiDebugTrapOrFault	Stack = 0xFFFFDD8179E95000
02:	fffff80138a7a140 nt!KiNmiInterrupt	Stack = 0xFFFFDD8179E8D000
03:	fffff80138a7a6c0 nt!KiBreakpointTrap
...
2e:	fffff80138a80e40 nt!KiSystemService
2f:	fffff80138a75750 nt!KiDpcInterrupt
30:	fffff80138a733c0 nt!KiHvInterrupt
31:	fffff80138a73720 nt!KiVmbusInterrupt0
32:	fffff80138a73a80 nt!KiVmbusInterrupt1
33:	fffff80138a73de0 nt!KiVmbusInterrupt2
34:	fffff80138a74140 nt!KiVmbusInterrupt3
35:	fffff80138a71d88 nt!HalpInterruptCmciService (KINTERRUPT ffffc70697f23900)

36:	fffff80138a71d90 nt!HalpInterruptCmciService (KINTERRUPT ffffc70697f23a20)

b0:	fffff80138a72160 ACPI!ACPIInterruptServiceRoutine (KINTERRUPT ffffdd817a1ecdc0)
...

Some things are missing, such as the keyboard interrupt handler. This is due to certain things handled “internally” as the VM is “enlightened”, meaning it “knows” it’s a VM. Normally, it’s a good thing – you get nice support for copy/paste between the VM and the host, seamless mouse and keyboard interaction, etc. But it does mean it’s not the same as another physical machine.

Level 3: Remote debugging of a physical machine

In this final level, you’re debugging a physical machine, which provides the most “authentic” experience. Setting this up is the trickiest. Full description of how to set it up is described in the debugger documentation. In general, it’s similar to the previous case, but network debugging might not work for you depending on the network card type your target and host machines have.

If network debugging is not supported because of the limited list of network cards supported, your best bet is USB debugging using a dedicated USB cable that you must purchase. The instructions to set up USB debugging are provided in the docs, but it may require some trial and error to locate the USB ports that support debugging (not all do). Once you have that set up, you’ll use the “USB” tab in the kernel attachment dialog on the host. Once connected, you can set breakpoints in ISRs that may not exist on a VM:

: kd> !idt

Dumping IDT: fffff8022f5b1000

00:	fffff80233236100 nt!KiDivideErrorFault
...
80:	fffff8023322cd70 i8042prt!I8042KeyboardInterruptService (KINTERRUPT ffffd102109c0500)
...
Dumping Secondary IDT: ffffe5815fa0e000 

01b0:hidi2c!OnInterruptIsr (KMDF) (KINTERRUPT ffffd10212e6edc0)

0: kd> bp i8042prt!I8042KeyboardInterruptService
0: kd> g
Breakpoint 0 hit
i8042prt!I8042KeyboardInterruptService:
fffff802`6dd42100 4889542410      mov     qword ptr [rsp+10h],rdx
0: kd> k
 # Child-SP          RetAddr               Call Site
00 fffff802`2f5cdf48 fffff802`331453cb     i8042prt!I8042KeyboardInterruptService
01 fffff802`2f5cdf50 fffff802`3322b25f     nt!KiCallInterruptServiceRoutine+0x16b
02 fffff802`2f5cdf90 fffff802`3322b527     nt!KiInterruptSubDispatch+0x11f
03 fffff802`2f5be9f0 fffff802`3322e13a     nt!KiInterruptDispatch+0x37
04 fffff802`2f5beb80 00000000`00000000     nt!KiIdleLoop+0x5a

Happy debugging!

Upcoming Public Training Classes for April/May

Today I’m happy to announce two training classes to take place in April and May. These classes will be in 4-hour session chunks, so that it’s easier to consume even for uncomfortable time zones.

The first is Advanced Windows Kernel Programming, a class I was promising for quite some time now… it will be held on the following dates:

  • April: 18, 20, 24, 27 and May: 1, 4, 8, 11 (4 days total)
  • Times: 11am to 3pm ET (8am-12pm PT, 4pm to 8pm UT/GMT)

The course will include advanced topics in Windows kernel development, and is recommended for those that were in my Windows Kernel Programming class or have equivalent knowledge; for example, by reading my book Windows Kernel Programming.

Example topics include: deep dive into Windows’ kernel design, working with APCs, Windows Filtering Platform callout drivers, advanced memory management techniques, plug & play filter drivers, and more!
The second class is Windows Internals to be held on the following dates:

  • May: 2, 3, 9, 10, 15, 18, 22, 24, 30 and June: 1, 5 (5.5 days)
  • Times: 11am to 3pm ET (8am-12pm PT, 4pm to 8pm UT/GMT)

The syllabus can be found here (some modifications possible, but the general outline remains).

Cost
950 USD (if paid by an individual), 1900 USD (if paid by a company). The cost is the same for these training classes. Previous students in my classes get 10% off.
Multiple participants from the same company get a discount as well (contact me for the details).

If you’d like to register, please send me an email to zodiacon@live.com with the name of the training in the email title, provide your full name, company (if any), preferred contact email, and your time zone.

The sessions will be recorded, so you can watch any part you may be missing, or that may be somewhat overwhelming in “real time”.

As usual, if you have any questions, feel free to send me an email, or DM on twitter (@zodiacon) or Linkedin (https://www.linkedin.com/in/pavely/).


Introduction to the Windows Filtering Platform

As part of the second edition of Windows Kernel Programming, I’m working on chapter 13 to describe the basics of the Windows Filtering Platform (WFP). The chapter will focus mostly on kernel-mode WFP Callout drivers (it is a kernel programming book after all), but I am also providing a brief introduction to WFP and its user-mode API.

This introduction (with some simplifications) is what this post is about. Enjoy!

The Windows Filtering Platform (WFP) provides flexible ways to control network filtering. It exposes user-mode and kernel-mode APIs, that interact with several layers of the networking stack. Some configuration and control is available directly from user-mode, without requiring any kernel-mode code (although it does require administrator-level access). WFP replaces older network filtering technologies, such as Transport Driver Interface (TDI) filters some types of NDIS filters.

If examining network packets (and even modification) is required, a kernel-mode Callout driver can be written, which is what we’ll be concerned with in this chapter. We’ll begin with an overview of the main pieces of WFP, look at some user-mode code examples for configuring filters before diving into building simple Callout drivers that allows fine-grained control over network packets.

WFP is comprised of user-mode and kernel-mode components. A very high-level architecture is shown here:

In user-mode, the WFP manager is the Base Filtering Engine (BFE), which is a service implemented by bfe.dll and hosted in a standard svchost.exe instance. It implements the WFP user-mode API, essentially managing the platform, talking to its kernel counterpart when needed. We’ll examine some of these APIs in the next section.

User-mode applications, services and other components can utilize this user-mode management API to examine WFP objects state, and make changes, such as adding or deleting filters. A classic example of such “user” is the Windows Firewall, which is normally controllable by leveraging the Microsoft Management Console (MMC) that is provided for this purpose, but using these APIs from other applications is just as effective.

The kernel-mode filter engine exposes various logical layers, where filters (and callouts) can be attached. Layers represent locations in the network processing of one or more packets. The TCP/IP driver makes calls to the WFP kernel engine so that it can decide which filters (if any) should be “invoked”.

For filters, this means checking the conditions set by the filter against the current request. If the conditions are satisfied, the filter’s action is applied. Common actions include blocking a request from being further processed, allowing the request to continue without further processing in this layer, continuing to the next filter in this layer (if any), and invoking a callout driver. Callouts can perform any kind of processing, such as examining and even modifying packet data.
The relationship between layers, filters, and callouts is shown here:

As you can see the diagram, each layer can have zero or more filters, and zero or more callouts. The number and meaning of the layers is fixed and provided out of the box by Windows. On most system, there are about 100 layers. Many of the layers are sets of pairs, where one is for IPv4 and the other (identical in purpose) is for IPv6.

The WFP Explorer tool I created provides some insight into what makes up WFP. Running the tool and selecting View/Layers from the menu (or clicking the Layers tool bar button) shows a view of all existing layers.

You can download the WFP Explorer tool from its Github repository
(https://github.com/zodiacon/WFPExplorer) or the AllTools repository
(https://github.com/zodiacon/AllTools).

Each layer is uniquely identified by a GUID. Its Layer ID is used internally by the kernel engine as an identifier rather than the GUID, as it’s smaller and so is faster (layer IDs are 16-bit only). Most layers have fields that can be used by filters to set conditions for invoking their actions. Double-clicking a layer shows its properties. The next figure shows the general properties of an example layer. Notice it has 382 filters and 2 callouts attached to it.

Clicking the Fields tab shows the fields available in this layer, that can be used by filters to set conditions.

The meaning of the various layers, and the meaning of the fields for the layers are all documented in the official WFP documentation.

The currently existing filters can be viewed in WFP Explorer by selecting Filters from the View menu. Layers cannot be added or removed, but filters can. Management code (user or kernel) can add and/or remove filters dynamically while the system is running. You can see that on the system the tool is running on there are currently 2978 filters.

Each filter is uniquely identified by a GUID, and just like layers has a “shorter” id (64-bit) that is used by the kernel engine to more quickly compare filter IDs when needed. Since multiple filters can be assigned to the same layer, some kind of ordering must be used when assessing filters. This is where the filter’s weight comes into play. A weight is a 64-bit value that is used to sort filters by priority. As you can see in figure 13-7, there are two weight properties – weight and effective weight. Weight is what is specified when adding the filter, but effective weight is the actual one used. There are three possible values to set for weight:

  • A value between 0 and 15 is interpreted by WFP as a weight index, which simply means that the effective weight is going to start with 4 bits having the specified weight value and generate the other 60 bit. For example, if the weight is set to 5, then the effective weight is going to be between 0x5000000000000000 and 0x5FFFFFFFFFFFFFFF.
  • An empty value tells WFP to generate an effective weight somewhere in the 64-bit range.
  • A value above 15 is taken as is to become the effective weight.

What is an “empty” value? The weight is not really a number, but a FWP_VALUE type can hold all sorts of values, including holding no value at all (empty).

Double-clicking a filter in WFP Explorer shows its general properties:

The Conditions tab shows the conditions this filter is configured with. When all the conditions are met, the action of the filter is going to fire.

The list of fields used by a filter must be a subset of the fields exposed by the layer this filter is attached to. There are six conditions shown in figure 13-9 out of the possible 39 fields supported by this layer (“ALE Receive/Accept v4 Layer”). As you can see, there is a lot of flexibility in specifying conditions for fields – this is evident in the matching enumeration, FWPM_MATCH_TYPE:

typedef enum FWP_MATCH_TYPE_ {
    FWP_MATCH_EQUAL    = 0,
    FWP_MATCH_GREATER,
    FWP_MATCH_LESS,
    FWP_MATCH_GREATER_OR_EQUAL,
    FWP_MATCH_LESS_OR_EQUAL,
    FWP_MATCH_RANGE,
    FWP_MATCH_FLAGS_ALL_SET,
    FWP_MATCH_FLAGS_ANY_SET,
    FWP_MATCH_FLAGS_NONE_SET,
    FWP_MATCH_EQUAL_CASE_INSENSITIVE,
    FWP_MATCH_NOT_EQUAL,
    FWP_MATCH_PREFIX,
    FWP_MATCH_NOT_PREFIX,
    FWP_MATCH_TYPE_MAX
} FWP_MATCH_TYPE;

The WFP API exposes its functionality for user-mode and kernel-mode callers. The header files used are different, to cater for differences in API expectations between user-mode and kernel-mode, but APIs in general are identical. For example, kernel APIs return NTSTATUS, whereas user-mode APIs return a simple LONG, that is the error value that is returned normally from GetLastError. Some APIs are provided for kernel-mode only, as they don’t make sense for user mode.

W> The user-mode WFP APIs never set the last error, and always return the error value directly. Zero (ERROR_SUCCESS) means success, while other (positive) values mean failure. Do not call GetLastError when using WFP – just look at the returned value.

WFP functions and structures use a versioning scheme, where function and structure names end with a digit, indicating version. For example, FWPM_LAYER0 is the first version of a structure describing a layer. At the time of writing, this was the only structure for describing a layer. As a counter example, there are several versions of the function beginning with FwpmNetEventEnum: FwpmNetEventEnum0 (for Vista+), FwpmNetEventEnum1 (Windows 7+), FwpmNetEventEnum2 (Windows 8+), FwpmNetEventEnum3 (Windows 10+), FwpmNetEventEnum4 (Windows 10 RS4+), and FwpmNetEventEnum5 (Windows 10 RS5+). This is an extreme example, but there are others with less “versions”. You can use any version that matches the target platform. To make it easier to work with these APIs and structures, a macro is defined with the base name that is expanded to the maximum supported version based on the target compilation platform. Here is part of the declarations for the macro FwpmNetEventEnum:

DWORD FwpmNetEventEnum0(
   _In_ HANDLE engineHandle,
   _In_ HANDLE enumHandle,
   _In_ UINT32 numEntriesRequested,
   _Outptr_result_buffer_(*numEntriesReturned) FWPM_NET_EVENT0*** entries,
   _Out_ UINT32* numEntriesReturned);
#if (NTDDI_VERSION >= NTDDI_WIN7)
DWORD FwpmNetEventEnum1(
   _In_ HANDLE engineHandle,
   _In_ HANDLE enumHandle,
   _In_ UINT32 numEntriesRequested,
   _Outptr_result_buffer_(*numEntriesReturned) FWPM_NET_EVENT1*** entries,
   _Out_ UINT32* numEntriesReturned);
#endif // (NTDDI_VERSION >= NTDDI_WIN7)
#if (NTDDI_VERSION >= NTDDI_WIN8)
DWORD FwpmNetEventEnum2(
   _In_ HANDLE engineHandle,
   _In_ HANDLE enumHandle,
   _In_ UINT32 numEntriesRequested,
   _Outptr_result_buffer_(*numEntriesReturned) FWPM_NET_EVENT2*** entries,
   _Out_ UINT32* numEntriesReturned);
#endif // (NTDDI_VERSION >= NTDDI_WIN8)

You can see that the differences in the functions relate to the structures returned as part of these APIs (FWPM_NET_EVENTx). It’s recommended you use the macros, and only turn to specific versions if there is a compelling reason to do so.

The WFP APIs adhere to strict naming conventions that make it easier to use. All management functions start with Fwpm (Filtering Windows Platform Management), and all management structures start with FWPM. The function names themselves use the pattern <prefix><object type><operation>, such as FwpmFilterAdd and FwpmLayerGetByKey.

It’s curious that the prefixes used for functions, structures, and enums start with FWP rather than the (perhaps) expected WFP. I couldn’t find a compelling reason for this.

WFP header files start with fwp and end with u for user-mode or k for kernel-mode. For example, fwpmu.h holds the management functions for user-mode callers, whereas fwpmk.h is the header for kernel callers. Two common files, fwptypes.h and fwpmtypes.h are used by both user-mode and kernel-mode headers. They are included by the “main” header files.

User-Mode Examples

Before making any calls to specific APIs, a handle to the WFP engine must be opened with FwpmEngineOpen:

DWORD FwpmEngineOpen0(
   _In_opt_ const wchar_t* serverName,  // must be NULL
   _In_ UINT32 authnService,            // RPC_C_AUTHN_DEFAULT
   _In_opt_ SEC_WINNT_AUTH_IDENTITY_W* authIdentity,
   _In_opt_ const FWPM_SESSION0* session,
   _Out_ HANDLE* engineHandle);

Most of the arguments have good defaults when NULL is specified. The returned handle must be used with subsequent APIs. Once it’s no longer needed, it must be closed:

DWORD FwpmEngineClose0(_Inout_ HANDLE engineHandle);

Enumerating Objects

What can we do with an engine handle? One thing provided with the management API is enumeration. These are the APIs used by WFP Explorer to enumerate layers, filters, sessions, and other object types in WFP. The following example displays some details for all the filters in the system (error handling omitted for brevity, the project wfpfilters has the full source code):

#include <Windows.h>
#include <fwpmu.h>
#include <stdio.h>
#include <string>

#pragma comment(lib, "Fwpuclnt")

std::wstring GuidToString(GUID const& guid) {
    WCHAR sguid[64];
    return ::StringFromGUID2(guid, sguid, _countof(sguid)) ? sguid : L"";
}

const char* ActionToString(FWPM_ACTION const& action) {
    switch (action.type) {
        case FWP_ACTION_BLOCK:               return "Block";
        case FWP_ACTION_PERMIT:              return "Permit";
        case FWP_ACTION_CALLOUT_TERMINATING: return "Callout Terminating";
        case FWP_ACTION_CALLOUT_INSPECTION:  return "Callout Inspection";
        case FWP_ACTION_CALLOUT_UNKNOWN:     return "Callout Unknown";
        case FWP_ACTION_CONTINUE:            return "Continue";
        case FWP_ACTION_NONE:                return "None";
        case FWP_ACTION_NONE_NO_MATCH:       return "None (No Match)";
    }
    return "";
}

int main() {
    //
    // open a handle to the WFP engine
    //
    HANDLE hEngine;
    FwpmEngineOpen(nullptr, RPC_C_AUTHN_DEFAULT, nullptr, nullptr, &hEngine);

    //
    // create an enumeration handle
    //
    HANDLE hEnum;
    FwpmFilterCreateEnumHandle(hEngine, nullptr, &hEnum);

    UINT32 count;
    FWPM_FILTER** filters;
    //
    // enumerate filters
    //
    FwpmFilterEnum(hEngine, hEnum, 
        8192,       // maximum entries, 
        &filters,   // returned result
        &count);    // how many actually returned

    for (UINT32 i = 0; i < count; i++) {
        auto f = filters[i];
        printf("%ws Name: %-40ws Id: 0x%016llX Conditions: %2u Action: %s\n",
            GuidToString(f->filterKey).c_str(),
            f->displayData.name,
            f->filterId,
            f->numFilterConditions,
            ActionToString(f->action));
    }
    //
    // free memory allocated by FwpmFilterEnum
    //
    FwpmFreeMemory((void**)&filters);

    //
    // close enumeration handle
    //
    FwpmFilterDestroyEnumHandle(hEngine, hEnum);

    //
    // close engine handle
    //
    FwpmEngineClose(hEngine);

    return 0;
}

The enumeration pattern repeat itself with all other WFP object types (layers, callouts, sessions, etc.).

Adding Filters

Let’s see if we can add a filter to perform some useful function. Suppose we want to prevent network access from some process. We can add a filter at an appropriate layer to make it happen. Adding a filter is a matter of calling FwpmFilterAdd:

DWORD FwpmFilterAdd0(
   _In_ HANDLE engineHandle,
   _In_ const FWPM_FILTER0* filter,
   _In_opt_ PSECURITY_DESCRIPTOR sd,
   _Out_opt_ UINT64* id);

The main work is to fill a FWPM_FILTER structure defined like so:

typedef struct FWPM_FILTER0_ {
    GUID filterKey;
    FWPM_DISPLAY_DATA0 displayData;
    UINT32 flags;
    /* [unique] */ GUID *providerKey;
    FWP_BYTE_BLOB providerData;
    GUID layerKey;
    GUID subLayerKey;
    FWP_VALUE0 weight;
    UINT32 numFilterConditions;
    /* [unique][size_is] */ FWPM_FILTER_CONDITION0 *filterCondition;
    FWPM_ACTION0 action;
    /* [switch_is] */ /* [switch_type] */ union 
        {
        /* [case()] */ UINT64 rawContext;
        /* [case()] */ GUID providerContextKey;
        }     ;
    /* [unique] */ GUID *reserved;
    UINT64 filterId;
    FWP_VALUE0 effectiveWeight;
} FWPM_FILTER0;

The weird-looking comments are generated by the Microsoft Interface Definition Language (MIDL) compiler when generating the header file from an IDL file. Although IDL is most commonly used by Component Object Model (COM) to define interfaces and types, WFP uses IDL to define its APIs, even though no COM interfaces are used; just plain C functions. The original IDL files are provided with the SDK, and they are worth checking out, since they may contain developer comments that are not “transferred” to the resulting header files.

Some members in FWPM_FILTER are necessary – layerKey to indicate the layer to attach this filter, any conditions needed to trigger the filter (numFilterConditions and the filterCondition array), and the action to take if the filter is triggered (action field).

Let’s create some code that prevents the Windows Calculator from accessing the network. You may be wondering why would calculator require network access? No, it’s not contacting Google to ask for the result of 2+2. It’s using the Internet for accessing current exchange rates.

Clicking the Update Rates button causes Calculator to consult the Internet for the updated exchange rate. We’ll add a filter that prevents this.

We’ll start as usual by opening handle to the WFP engine as was done in the previous example. Next, we need to fill the FWPM_FILTER structure. First, a nice display name:

FWPM_FILTER filter{};   // zero out the structure
WCHAR filterName[] = L"Prevent Calculator from accessing the web";
filter.displayData.name = filterName;

The name has no functional part – it just allows easy identification when enumerating filters. Now we need to select the layer. We’ll also specify the action:

filter.layerKey = FWPM_LAYER_ALE_AUTH_CONNECT_V4;
filter.action.type = FWP_ACTION_BLOCK;

There are several layers that could be used for blocking access, with the above layer being good enough to get the job done. Full description of the provided layers, their purpose and when they are used is provided as part of the WFP documentation.

The last part to initialize is the conditions to use. Without conditions, the filter is always going to be invoked, which will block all network access (or just for some processes, based on its effective weight). In our case, we only care about the application – we don’t care about ports or protocols. The layer we selected has several fields, one of with is called ALE App ID (ALE stands for Application Layer Enforcement).

This field can be used to identify an executable. To get that ID, we can use FwpmGetAppIdFromFileName. Here is the code for Calculator’s executable:

WCHAR filename[] = LR"(C:\Program Files\WindowsApps\Microsoft.WindowsCalculator_11.2210.0.0_x64__8wekyb3d8bbwe\CalculatorApp.exe)";
FWP_BYTE_BLOB* appId;
FwpmGetAppIdFromFileName(filename, &appId);

The code uses the path to the Calculator executable on my system – you should change that as needed because Calculator’s version might be different. A quick way to get the executable path is to run Calculator, open Process Explorer, open the resulting process properties, and copy the path from the Image tab.

The R"( and closing parenthesis in the above snippet disable the “escaping” property of backslashes, making it easier to write file paths (C++ 14 feature).

The return value from FwpmGetAppIdFromFileName is a BLOB that needs to be freed eventually with FwpmFreeMemory.

Now we’re ready to specify the one and only condition:

FWPM_FILTER_CONDITION cond;
cond.fieldKey = FWPM_CONDITION_ALE_APP_ID;      // field
cond.matchType = FWP_MATCH_EQUAL;
cond.conditionValue.type = FWP_BYTE_BLOB_TYPE;
cond.conditionValue.byteBlob = appId;

filter.filterCondition = &cond;
filter.numFilterConditions = 1;

The conditionValue member of FWPM_FILTER_CONDITION is a FWP_VALUE, which is a generic way to specify many types of values. It has a type member that indicates the member in a big union that should be used. In our case, the type is a BLOB (FWP_BYTE_BLOB_TYPE) and the actual value should be passed in the byteBlob union member.

The last step is to add the filter, and repeat the exercise for IPv6, as we don’t know how Calculator connects to the currency exchange server (we can find out, but it would be simpler and more robust to just block IPv6 as well):

FwpmFilterAdd(hEngine, &filter, nullptr, nullptr);

filter.layerKey = FWPM_LAYER_ALE_AUTH_CONNECT_V6;   // IPv6
FwpmFilterAdd(hEngine, &filter, nullptr, nullptr);

We didn’t specify any GUID for the filter. This causes WFP to generate a GUID. We didn’t specify weight, either. WFP will generate them.

All that’s left now is some cleanup:

FwpmFreeMemory((void**)&appId);
FwpmEngineClose(hEngine);

Running this code (elevated) should and trying to refresh the currency exchange rate with Calculator should fail. Note that there is no need to restart Calculator – the effect is immediate.

We can locate the filters added with WFP Explorer:

Double-clicking one of the filters and selecting the Conditions tab shows the only condition where the App ID is revealed to be the full path of the executable in device form. Of course, you should not take any dependency on this format, as it may change in the future.

You can right-click the filters and delete them using WFP Explorer. The FwpmFilterDeleteByKey API is used behind the scenes. This will restore Calculator’s exchange rate update functionality.

Unnamed Directory Objects

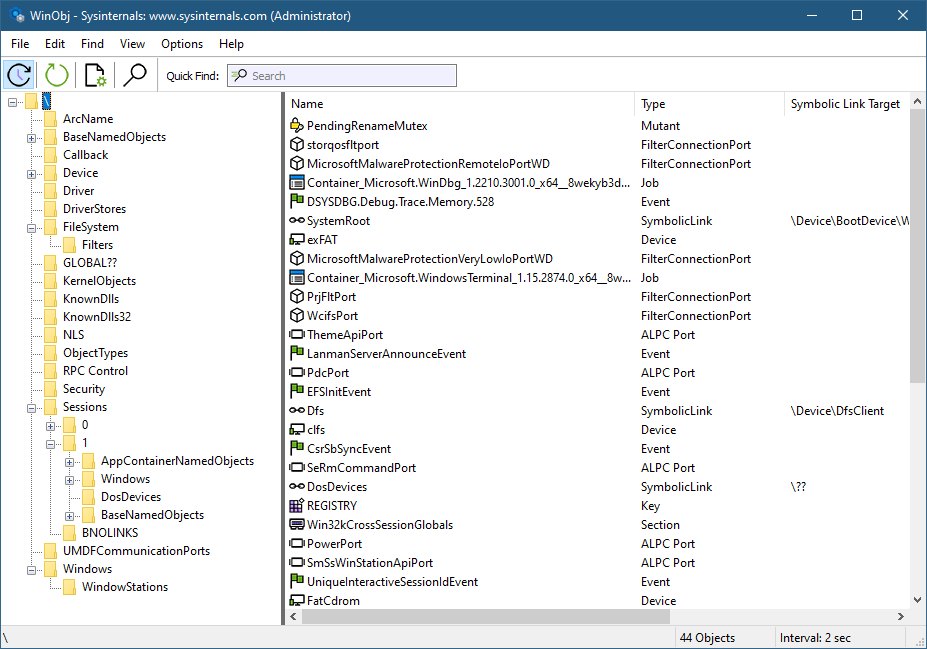
A lot of the functionality in Windows is based around various kernel objects. One such object is a Directory, not to be confused with a directory in a file system. A Directory object is conceptually simple: it’s a container for other kernel objects, including other Directory objects, thus creating a hierarchy used by the kernel’s Object Manager to manage named objects. This arrangement can be easily seen with tools like WinObj from Sysinternals:

The left part of WinObj shows object manager directories, where named objects are “stored” and can be located by name. Clear and simple enough.

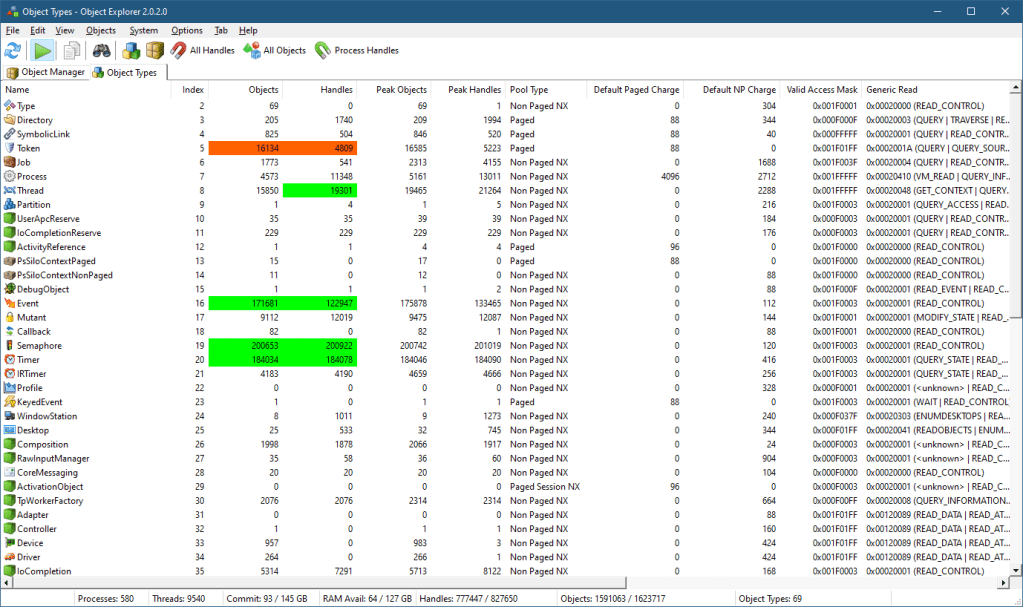
However, Directory objects can be unnamed as well as named. How can this be? Here is my Object Explorer tool (similar functionality is available with my System Explorer tool as well). One of its views is a “statistical” view of all object types, some of their properties, such as their name, type index, number of objects and handles, peak number of objects and handles, generic access mapping, and the pool type they’re allocated from.

If you right-click the Directory object type and select “All Objects”, you’ll see another view that shows all Directory objects in the system (well, not necessarily all, but most*).

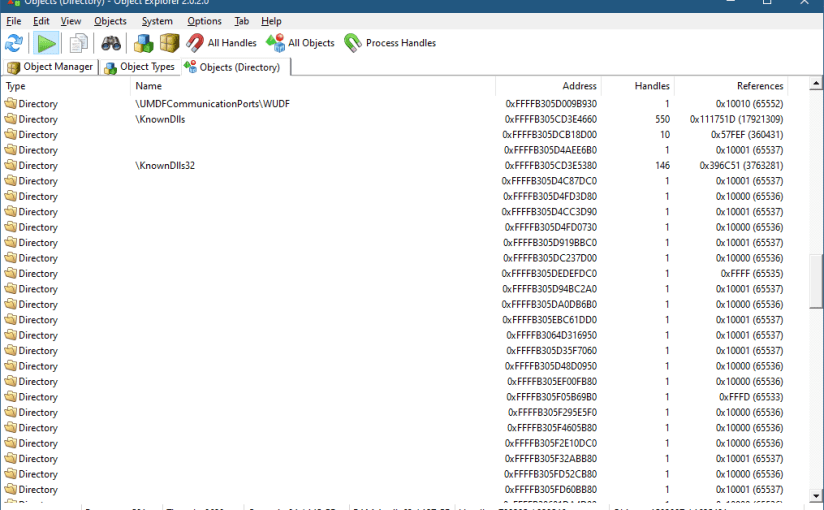
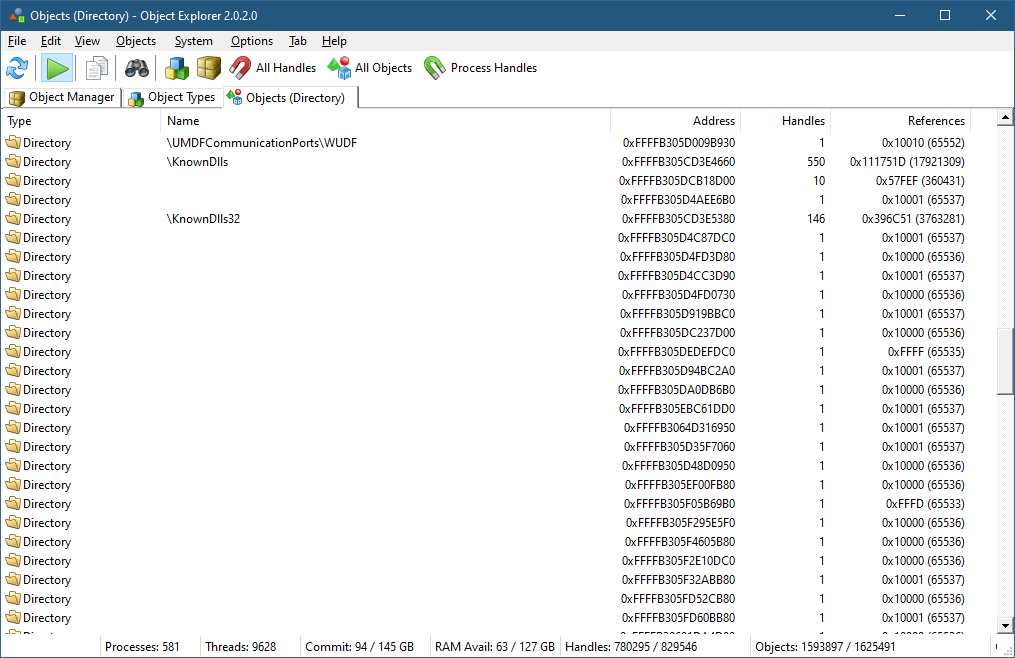
If you scroll a bit, you’ll see many unnamed Directory objects that have no name:

It seems weird, as a Directory with no name doesn’t make sense. These directories, however, are “real” and serve an important purpose – managing a private object namespace. I blogged about private object namespaces quite a few years ago (it was in my old blog site that is now unfortunately lost), but here is the gist of it:

Object names are useful because they allow easy sharing between processes. For example, if two or more processes would like to share memory, they can create a memory mapped file object (called Section within the kernel) with a name they are all aware of. Calling CreateFileMapping (or one of its variants) with the same name will create the object (by the first caller), where subsequent callers get handles to the existing object because it was looked up by name.

This is easy and useful, but there is a possible catch: since the name is “visible” using tools or APIs, other processes can “interfere” with the object by getting their own handle using that visible name and “meddle” with the object, maliciously or accidentally.

The solution to this problem arrived in Windows Vista with the idea of private object namespaces. A set of cooperating processes can create a private namespace only they can use, protected by a “secret” name and more importantly a boundary descriptor. The details are beyond the scope of this post, but it’s all documented in the Windows API functions such as CreateBoundaryDescriptor, CreatePrivateNamespace and friends. Here is an example of using these APIs to create a private namespace with a section object in it (error handling omitted):

HANDLE hBD = ::CreateBoundaryDescriptor(L"MyDescriptor", 0);
BYTE sid[SECURITY_MAX_SID_SIZE];
auto psid = reinterpret_cast<PSID>(sid);
DWORD sidLen;
::CreateWellKnownSid(WinBuiltinUsersSid, nullptr, psid, &sidLen);
::AddSIDToBoundaryDescriptor(&m_hBD, psid);

// create the private namespace
hNamespace = ::CreatePrivateNamespace(nullptr, hBD, L"MyNamespace");
if (!hNamespace) { // maybe created already?
	hNamespace = ::OpenPrivateNamespace(hBD, L"MyNamespace");
namespace");
}

HANDLE hSharedMem = ::CreateFileMapping(INVALID_HANDLE_VALUE, nullptr, PAGE_READWRITE, 0, 1 << 12, L"MyNamespace\\MySharedMem"));

This snippet is taken from the PrivateSharing code example from the Windows 10 System Programming part 1 book.

If you run this demo application, and look at the resulting handle (hSharedMem) in the above code in a tool like Process Explorer or Object Explorer you’ll see the name of the object is not given:

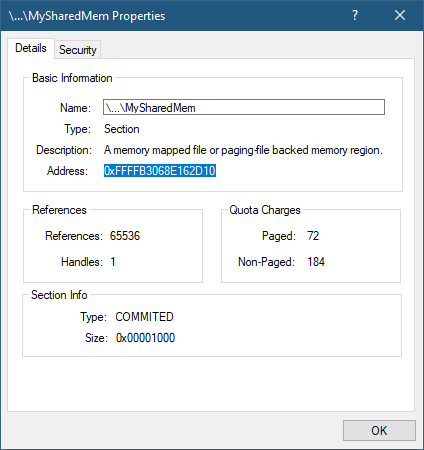
The full name is not shown and cannot be retrieved from user mode. And even if it could somehow be located, the boundary descriptor provides further protection. Let’s examine this object in the kernel debugger. Copying its address from the object’s properties:

Pasting the address into a local kernel debugger – first using the generic !object command:

lkd> !object 0xFFFFB3068E162D10
Object: ffffb3068e162d10  Type: (ffff9507ed78c220) Section
    ObjectHeader: ffffb3068e162ce0 (new version)
    HandleCount: 1  PointerCount: 32769
    Directory Object: ffffb3069e8cbe00  Name: MySharedMem

The name is there, but the directory object is there as well. Let’s examine it:

lkd> !object ffffb3069e8cbe00
Object: ffffb3069e8cbe00  Type: (ffff9507ed6d0d20) Directory
    ObjectHeader: ffffb3069e8cbdd0 (new version)
    HandleCount: 3  PointerCount: 98300

    Hash Address          Type                      Name
    ---- -------          ----                      ----
     19  ffffb3068e162d10 Section                   MySharedMem

There is one object in this directory. What’s the directory’s name? We need to examine the object header for that – its address is given in the above output:

lkd> dt nt!_OBJECT_HEADER ffffb3069e8cbdd0
   +0x000 PointerCount     : 0n32769
   +0x008 HandleCount      : 0n1
   +0x008 NextToFree       : 0x00000000`00000001 Void
   +0x010 Lock             : _EX_PUSH_LOCK
   +0x018 TypeIndex        : 0x53 'S'
   +0x019 TraceFlags       : 0 ''
   +0x019 DbgRefTrace      : 0y0
   +0x019 DbgTracePermanent : 0y0
   +0x01a InfoMask         : 0x8 ''
   +0x01b Flags            : 0 ''
   +0x01b NewObject        : 0y0
   +0x01b KernelObject     : 0y0
   +0x01b KernelOnlyAccess : 0y0
   +0x01b ExclusiveObject  : 0y0
   +0x01b PermanentObject  : 0y0
   +0x01b DefaultSecurityQuota : 0y0
   +0x01b SingleHandleEntry : 0y0
   +0x01b DeletedInline    : 0y0
   +0x01c Reserved         : 0x301
   +0x020 ObjectCreateInfo : 0xffff9508`18f2ba40 _OBJECT_CREATE_INFORMATION
   +0x020 QuotaBlockCharged : 0xffff9508`18f2ba40 Void
   +0x028 SecurityDescriptor : 0xffffb305`dd0d56ed Void
   +0x030 Body             : _QUAD

Getting a kernel’s object name is a little tricky, and will not be fully described here. The first requirement is the InfoMask member must have bit 1 set (value of 2), as this indicates a name is present. Since it’s not (the value is 8), there is no name to this directory. We can examine the directory object in more detail by looking at the real data structure underneath given the object’s original address:

kd> dt nt!_OBJECT_DIRECTORY ffffb3069e8cbe00
   +0x000 HashBuckets      : [37] (null) 
   +0x128 Lock             : _EX_PUSH_LOCK
   +0x130 DeviceMap        : (null) 
   +0x138 ShadowDirectory  : (null) 
   +0x140 NamespaceEntry   : 0xffffb306`9e8cbf58 Void
   +0x148 SessionObject    : (null) 
   +0x150 Flags            : 1
   +0x154 SessionId        : 0xffffffff

The interesting piece is the NamespaceEntry member, which is not-NULL. This indicates the purpose of this directory: to be a container for a private namespace’s objects. You can also click on HasBuckets and locate the single section object there.

Going back to Process Explorer, enabling unnamed object handles (View menu, Show Unnamed Handles and Mappings) and looking for unnamed directory objects:

The directory’s address is the same one we were looking at!

The pointer at NamespaceEntry points to an undocumented structure that is not currently provided with the symbols. But just looking a bit beyond the directory’s object structure shows a hint:

lkd> db ffffb3069e8cbe00+158
ffffb306`9e8cbf58  d8 f9 a3 55 06 b3 ff ff-70 46 12 66 07 f8 ff ff  ...U....pF.f....
ffffb306`9e8cbf68  00 be 8c 9e 06 b3 ff ff-48 00 00 00 00 00 00 00  ........H.......
ffffb306`9e8cbf78  00 00 00 00 00 00 00 00-0b 00 00 00 00 00 00 00  ................
ffffb306`9e8cbf88  01 00 00 00 02 00 00 00-48 00 00 00 00 00 00 00  ........H.......
ffffb306`9e8cbf98  01 00 00 00 20 00 00 00-4d 00 79 00 44 00 65 00  .... ...M.y.D.e.
ffffb306`9e8cbfa8  73 00 63 00 72 00 69 00-70 00 74 00 6f 00 72 00  s.c.r.i.p.t.o.r.
ffffb306`9e8cbfb8  02 00 00 00 18 00 00 00-01 02 00 00 00 00 00 05  ................
ffffb306`9e8cbfc8  20 00 00 00 21 02 00 00-00 00 00 00 00 00 00 00   ...!...........

The name “MyDescriptor” is clearly visible, which is the name of the boundary descriptor in the above code.

The kernel debugger’s documentation indicates that the !object command with a -p switch should show the private namespaces. However, this fails:

lkd> !object -p
00000000: Unable to get value of ObpPrivateNamespaceLookupTable

The debugger seems to fail locating a global kernel variable. This is probably a bug in the debugger command, because object namespaces scope has changed since the introduction of Server Silos in Windows 10 version 1607 (for example, Docker uses these when running Windows containers). Each silo has its own object manager namespace, so the old global variable does not exist anymore. I suspect Microsoft has not updated this command switch to support silos. Even with no server silos running, the host is considered to be in its own (global) silo, called host silo. You can see its details by utilizing the !silo debugger command:

kd> !silo -g host
Server silo globals fffff80766124540:
		Default Error Port: ffff950815bee140
		ServiceSessionId  : 0
		OB Root Directory : 
		State             : Running

Clicking the “Server silo globals” link, shows more details:

kd> dx -r1 (*((nt!_ESERVERSILO_GLOBALS *)0xfffff80766124540))
(*((nt!_ESERVERSILO_GLOBALS *)0xfffff80766124540))                 [Type: _ESERVERSILO_GLOBALS]
    [+0x000] ObSiloState      [Type: _OBP_SILODRIVERSTATE]
    [+0x2e0] SeSiloState      [Type: _SEP_SILOSTATE]
    [+0x310] SeRmSiloState    [Type: _SEP_RM_LSA_CONNECTION_STATE]
    [+0x360] EtwSiloState     : 0xffff9507edbc9000 [Type: _ETW_SILODRIVERSTATE *]
    [+0x368] MiSessionLeaderProcess : 0xffff95080bbdb040 [Type: _EPROCESS *]
    [+0x370] ExpDefaultErrorPortProcess : 0xffff950815bee140 [Type: _EPROCESS *]
<truncated>

ObSiloState is the root object related to the object manager. Clicking this one shows:

lkd> dx -r1 (*((ntkrnlmp!_OBP_SILODRIVERSTATE *)0xfffff80766124540))
(*((ntkrnlmp!_OBP_SILODRIVERSTATE *)0xfffff80766124540))                 [Type: _OBP_SILODRIVERSTATE]
    [+0x000] SystemDeviceMap  : 0xffffb305c8c48720 [Type: _DEVICE_MAP *]
    [+0x008] SystemDosDeviceState [Type: _OBP_SYSTEM_DOS_DEVICE_STATE]
    [+0x078] DeviceMapLock    [Type: _EX_PUSH_LOCK]
    [+0x080] PrivateNamespaceLookupTable [Type: _OBJECT_NAMESPACE_LOOKUPTABLE]

PrivateNamespaceLookupTable is the root object for the private namespaces for this Silo (in this example it’s the host silo).

The interested reader is welcome to dig into this further.

The list of private namespaces is provided with the WinObjEx64 tool if you run it elevated and have local kernel debugging enabled, as it uses the kernel debugger’s driver to read kernel memory.

* Most objects, because the way Object Explorer works is by enumerating handles and associating them with objects. However, some objects are held using references from the kernel with zero handles. Such objects cannot be detected by Object Explorer.

Upcoming COM Programming Class

Today I’m happy to announce the next COM Programming class to be held in February 2023. The syllabus for the 3 day class can be found here. The course will be delivered in 6 half-days (4 hours each).

Dates: February (7, 8, 9, 14, 15, 16).
Times: 11am to 3pm EST (8am to 12pm PST) (4pm to 8pm UT)
Cost: 750 USD (if paid by an individual), 1400 USD (if paid by a company).

Half days should make it comfortable enough even if you’re not in an ideal time zone.

The class will be conducted remotely using Microsoft Teams.

What you need to know before the class: You should be comfortable using Windows on a Power User level. Concepts such as processes, threads, DLLs, and virtual memory should be understood fairly well. You should have experience writing code in C and some C++. You don’t have to be an expert, but you must know C and basic C++ to get the most out of this class. In case you have doubts, talk to me.

Participants in my Windows Internals and Windows System Programming classes have the required knowledge for the class.

We’ll start by looking at why COM was created in the first place, and then build clients and servers, digging into various mechanisms COM provides. See the syllabus for more details.

Previous students in my classes get 10% off. Multiple participants from the same company get a discount (email me for the details).

To register, send an email to zodiacon@live.com with the title “COM Programming Training”, and write the name(s), email(s) and time zone(s) of the participants.

Next Windows Internals Training

I’m happy to open registration for the next 5 day Windows Internals training to be conducted in November in the following dates and from 11am to 7pm, Eastern Standard Time (EST) (8am to 4pm PST): 21, 22, 28, 29, 30.

The syllabus can be found here (some modifications possible, but the general outline should remain).

Training cost is 900 USD if paid by an individual, or 1800 USD if paid by a company. Participants in any of my previous training classes get 10% off.

If you’d like to register, please send me an email to zodiacon@live.com with “Windows Internals training” in the title, provide your full name, company (if any), preferred contact email, and your time zone.

The sessions will be recorded, so you can watch any part you may be missing, or that may be somewhat overwhelming in “real time”.

As usual, if you have any questions, feel free to send me an email, or DM on twitter (@zodiacon) or Linkedin (https://www.linkedin.com/in/pavely/).

Introduction to Monikers

The foundations of the Component Object Model (COM) are made of two principles:

  1. Clients program against interfaces, never concrete classes.
  2. Location transparency – clients need not know where the actual object is (in-process, out-of-process, another machine).

Although simple in principle, there are many details involved in COM, as those with COM experience are well aware. In this post, I’d like to introduce one extensibility aspect of COM called Monikers.

The idea of a moniker is to provide some way to identify and locate specific objects based on string names instead of some custom mechanism. Windows provides some implementations of monikers, most of which are related to Object Linking and Embedding (OLE), most notably used in Microsoft Office applications. For example, when an Excel chart is embedded in a Word document as a link, an Item moniker is used to point to that specific chart using a string with a specific format understood by the moniker mechanism and the specific monikers involved. This also suggests that monikers can be combined, which is indeed the case. For example, a cell in some Excel document can be located by going to a specific sheet, then a specific range, then a specific cell – each one could be pointed to by a moniker, that when chained together can locate the required object.

Let’s start with perhaps the simplest example of an existing moniker implementation – the Class moniker. This moniker can be used to replace a creation operation. Here is an example that creates a COM object using the “standard” mechanism of calling CoCreateInstance:

#include <shlobjidl.h>
//...
CComPtr<IShellWindows> spShell;
auto hr = spShell.CoCreateInstance(__uuidof(ShellWindows));

I use the ATL smart pointers (#include <atlcomcli.h> or <atlbase.h>). The interface and class I’m using is just an example – any standard COM class would work. The CoCreateInstance method calls the real CoCreateInstance. To make it clearer, here is the CoCreateInstance call without using the helper provided by the smart pointer:

CComPtr<IShellWindows> spShell;
auto hr = ::CoCreateInstance(__uuidof(ShellWindows), nullptr, 
    CLSCTX_ALL, __uuidof(IShellWindows), 
    reinterpret_cast<void**>(&spShell));

CoCreateInstance itself is a glorified wrapper for calling CoGetClassObject to retrieve a class factory, requesting the standard IClassFactory interface, and then calling CreateInstance on it:

CComPtr<IClassFactory> spCF;
auto hr = ::CoGetClassObject(__uuidof(ShellWindows), 
    CLSCTX_ALL, nullptr, __uuidof(IClassFactory), 
    reinterpret_cast<void**>(&spCF));
if (SUCCEEDED(hr)) {
    CComPtr<IShellWindows> spShell;
    hr = spCF->CreateInstance(nullptr, __uuidof(IShellWindows),
        reinterpret_cast<void**>(&spShell));
    if (SUCCEEDED(hr)) {
        // use spShell
    }
}

Here is where the Class moniker comes in: It’s possible to get a class factory directly using a string like so:

CComPtr<IClassFactory> spCF;
BIND_OPTS opts{ sizeof(opts) };
auto hr = ::CoGetObject(
    L"clsid:9BA05972-F6A8-11CF-A442-00A0C90A8F39", 
    &opts, __uuidof(IClassFactory), 
    reinterpret_cast<void**>(&spCF));

Using CoGetObject is the most convenient way in C++ to locate an object based on a moniker. The moniker name is the string provided to CoGetObject. It starts with a ProgID of sorts followed by a colon. The rest of the string is to be interpreted by the moniker behind the scenes. With the class factory in hand, the code can use IClassFactory::CreateInstance just as with the previous example.

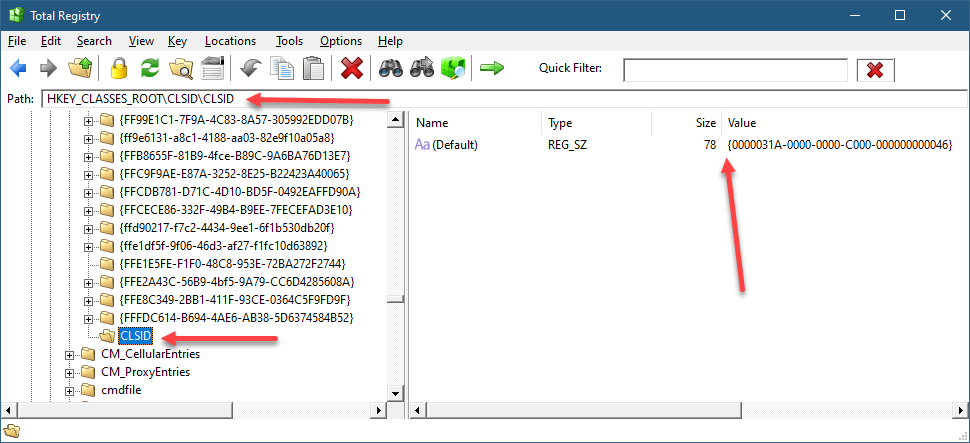
How does it work? As is usual with COM, the Registry is involved. If you open RegEdit or TotalRegistry and navigate to HKYE_CLASSES_ROOT, ProgIDs are all there. One of them is “clsid” – yes, it’s a bit weird perhaps, but the entry point to the moniker system is that ProgID. Each ProgID should have a CLSID subkey pointing to the class ID of the moniker. So here, the key is HKCR\CLSID\CLSID!

Class Moniker Registration

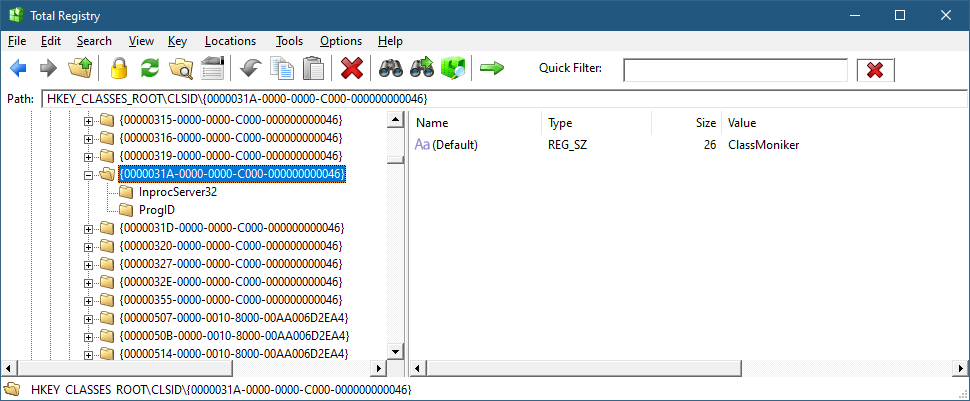
Of course, other monikers have different names (not CLSID). If we follow the CLSID on the right to the normal location for COM CLSID registration (HKCR\CLSID), this is what we find:

Class moniker

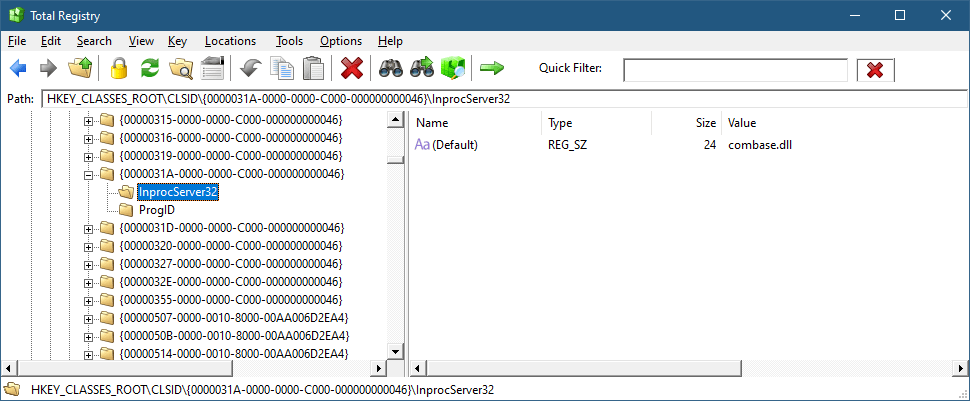
And the InProcServer32 subkey points to Combase.dll, the DLL implementing the COM infrastructure:

Class Moniker Implementation

At this point, we know how the class moniker got discovered, but it’s still not clear what is that moniker and where is it anyway?

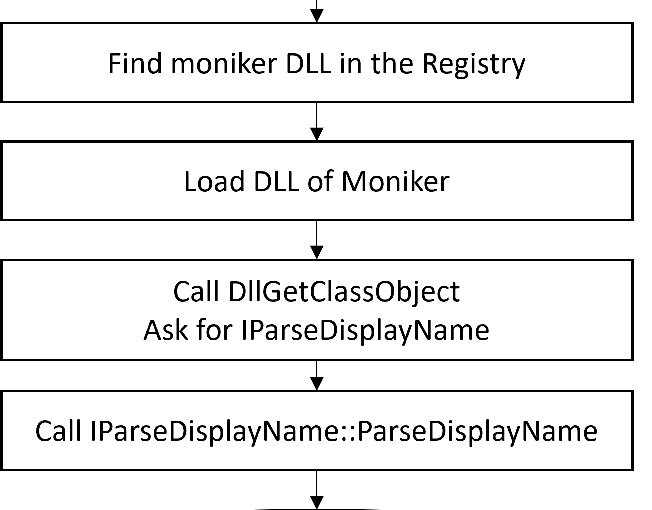
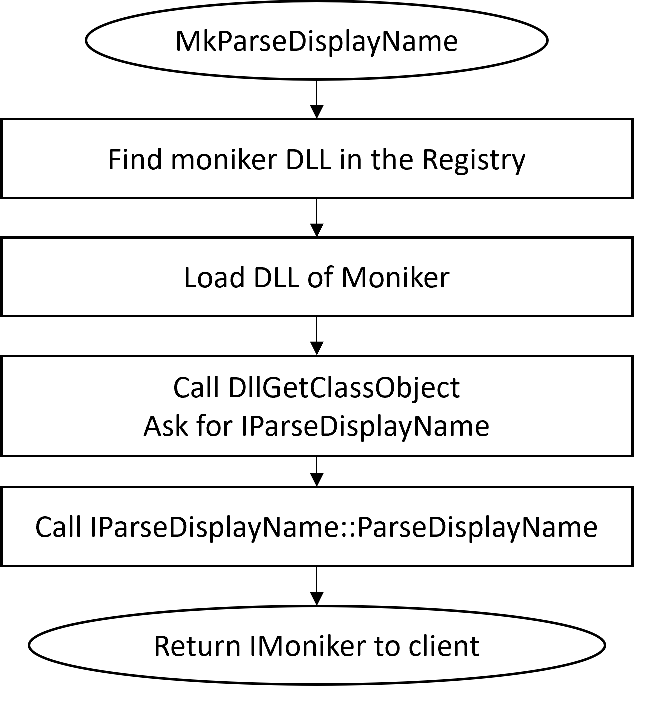
As mentioned earlier, CoGetObject is the simplest way to get an object from a moniker, as it hides the details of the moniker itself. CoGetObject is a shortcut for calling MkParseDisplayName – the real entry point to the COM moniker namespace. Here is the full way to get a class moniker by going through the moniker:

CComPtr<IMoniker> spClsMoniker;
CComPtr<IBindCtx> spBindCtx;
::CreateBindCtx(0, &spBindCtx);
ULONG eaten;
CComPtr<IClassFactory> spCF;
auto hr = ::MkParseDisplayName(
    spBindCtx,
    L"clsid:9BA05972-F6A8-11CF-A442-00A0C90A8F39",
    &eaten, &spClsMoniker);
if (SUCCEEDED(hr)) {
    spClsMoniker->BindToObject(spBindCtx, nullptr,
        __uuidof(IClassFactory), reinterpret_cast<void**>(&spCF));

MkParseDisplayName takes a “display name” – a string, and attempts to locate the moniker based on the information in the Registry (it actually has some special code for certain OLE stuff which is not interesting in this context). The Bind Context is a helper object that can (in the general case) contain an arbitrary set of properties that can be used by the moniker to customize the way it interprets the display name. The class moniker does not use any property, but it’s still necessary to provide the object even if it has no interesting data in it. If successful, MkParseDisplayName returns the moniker interface pointer, implementing the IMoniker interface that all monikers must implement. IMoniker is somewhat a scary interface, having 20 methods (excluding IUnknown). Fortunately, not all have to be implemented. We’ll get to implementing our own moniker soon.

The primary method in IMoniker is BindToObject, which is tasked of interpreting the display name, if possible, and returning the real object that the client is trying to locate. The client provides the interface it expects the target object to implement – IClassFactory in the case of a class moniker.

You might be wondering what’s the point of the class moniker if you could simply create the required object directly with the normal class factory. One advantage of the moniker is that a string is involved, which allows “late binding” of sorts, and allows other languages, such as scripting languages, to create COM objects indirectly. For example, VBScript provides the GetObject function that calls CoGetObject.

Implementing a Moniker

Some details are still missing, such as how does the moniker object itself gets created? To show that, let’s implement our own moniker. We’ll call it the Process Moniker – its purpose is to locate a COM process object we’ll implement that allows working with a Windows Process object.

Here is an example of something a client would do to find a process object based on its PID, and then display its executable path:

BIND_OPTS opts{ sizeof(opts) };
CComPtr<IWinProcess> spProcess;
auto hr = ::CoGetObject(L"process:3284", 
    &opts, __uuidof(IWinProcess), 
    reinterpret_cast<void**>(&spProcess));
if (SUCCEEDED(hr)) {
    CComBSTR path;
    if (S_OK == spProcess->get_ImagePath(&path)) {
        printf("Image path: %ws\n", path.m_str);
    }
}

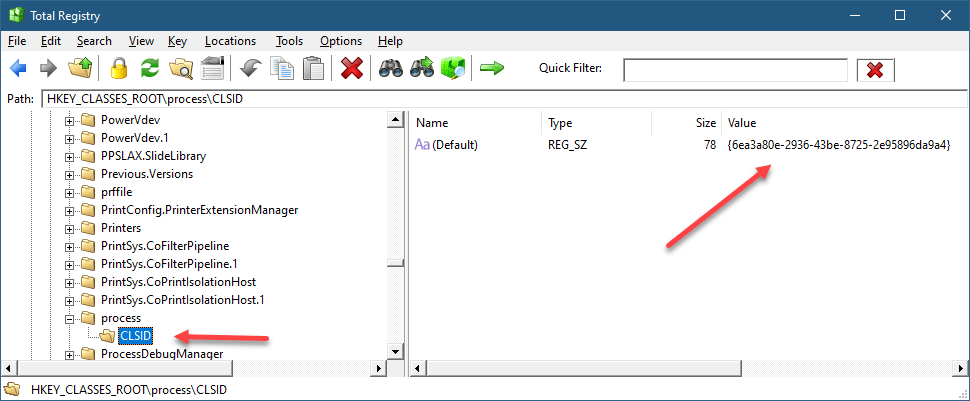
The IWinProcess is the interface our process object implements, but there is no need to know its CLSID (in fact, it has none, and is created privately by the moniker). The display name “prcess:3284” identifies the string “process” as the moniker name, meaning there must be a subkey under HKCR named “process” for this to have any chance of working. And under the “process” key there must be the CLSID of the moniker. Here is the final result:

process moniker

The CLSID of the process moniker must be registered normally like all COM classes. The text after the colon is passed to the moniker which should interpret it in a way that makes sense for that moniker (or fail trying). In our case, it’s supposed to be a PID of an existing process.

Let’s see the main steps needed to implement the process moniker. From a technical perspective, I created an ATL DLL project in Visual Studio (could be an EXE as well), and then added an “ATL Simple Object” class template to get the boilerplate code the ATL template provides. We just need to implement IMoniker – no need for some custom interface. Here is the layout of the class:

class ATL_NO_VTABLE CProcessMoniker :
	public CComObjectRootEx<CComMultiThreadModel>,
	public CComCoClass<CProcessMoniker, &CLSID_ProcessMoniker>,
	public IMoniker {
public:
	DECLARE_REGISTRY_RESOURCEID(106)
	DECLARE_CLASSFACTORY_EX(CMonikerClassFactory)

	BEGIN_COM_MAP(CProcessMoniker)
		COM_INTERFACE_ENTRY(IMoniker)
	END_COM_MAP()

	DECLARE_PROTECT_FINAL_CONSTRUCT()
	HRESULT FinalConstruct() {
		return S_OK;
	}
	void FinalRelease() {
	}

public:
	// Inherited via IMoniker
	HRESULT __stdcall GetClassID(CLSID* pClassID) override;
	HRESULT __stdcall IsDirty(void) override;
	HRESULT __stdcall Load(IStream* pStm) override;
	HRESULT __stdcall Save(IStream* pStm, BOOL fClearDirty) override;
	HRESULT __stdcall GetSizeMax(ULARGE_INTEGER* pcbSize) override;
	HRESULT __stdcall BindToObject(IBindCtx* pbc, IMoniker* pmkToLeft, REFIID riidResult, void** ppvResult) override;
    // other IMoniker methods...
	std::wstring m_DisplayName;
};

OBJECT_ENTRY_AUTO(__uuidof(ProcessMoniker), CProcessMoniker)

Those familiar with the typical code the ATL wizard generates might notice one important difference from the standard template: the class factory. It turns out that monikers are not created by an IClassFactory when called by a client invoking MkParseDisplayName (or its CoGetObject wrapper), but instead must implement the interface IParseDisplayName, which we’ll tackle in a moment. This is why DECLARE_CLASSFACTORY_EX(CMonikerClassFactory) is used to instruct ATL to use a custom class factory which we must implement.

MkParseDisplayName operation

Before we get to that, let’s implement the “main” method – BindToObject. We have to assume that the m_DisplayName member already has the process ID – it will be provided by our class factory that creates our moniker. First, we’ll convert the display name to a number:

HRESULT __stdcall CProcessMoniker::BindToObject(IBindCtx* pbc, IMoniker* pmkToLeft, REFIID riidResult, void** ppvResult) {
	auto pid = std::stoul(m_DisplayName);

Next, we’ll attempt to open a handle to the process:

auto hProcess = ::OpenProcess(PROCESS_QUERY_LIMITED_INFORMATION, 
    FALSE, pid);
if (!hProcess)
    return HRESULT_FROM_WIN32(::GetLastError());

If we fail, we just return a failed HRESULT and we’re done. If successful, we can create the WinProcess object, pass the handle and return the interface requested by the client (if supported):

	CComObject<CWinProcess>* pProcess;
	auto hr = pProcess->CreateInstance(&pProcess);
	pProcess->SetHandle(hProcess);
	pProcess->AddRef();
	
	hr = pProcess->QueryInterface(riidResult, ppvResult);
	pProcess->Release();
	return hr;
}

The creation of the object is internal via CComObject<>. The WinProcess COM class is not registered, which is just a matter of choice. I decided, a WinProcess object can only be obtained through the Process Moniker.

The calls to AddRef/Release may be puzzling, but there is a good reason for using them. When creating a CComObject<> object, the reference count of the object is zero. Then, the call to AddRef increments it to 1. Next, if the QueryInterface call succeeds, the ref count is incremented to 2. Then, the Release call decrements it to 1, as that is the correct count when the object is returned to the client. If, however, the call to QI fails, the ref count remains at 1, and the Release call will destroy the object! More elegant than calling delete.

SetHandle is a function in CWinProcess (outside the IWinProcess interface) that passes the handle to the object.

The WinProcess COM class is the uninteresting part in all of these, so I created a bare minimum class like so:

class ATL_NO_VTABLE CWinProcess :
	public CComObjectRootEx<CComMultiThreadModel>,
	public IDispatchImpl<IWinProcess> {
public:
	DECLARE_NO_REGISTRY()

	BEGIN_COM_MAP(CWinProcess)
		COM_INTERFACE_ENTRY(IWinProcess)
		COM_INTERFACE_ENTRY(IDispatch)
		COM_INTERFACE_ENTRY_AGGREGATE(IID_IMarshal, m_pUnkMarshaler.p)
	END_COM_MAP()

	DECLARE_PROTECT_FINAL_CONSTRUCT()
	DECLARE_GET_CONTROLLING_UNKNOWN()

	HRESULT FinalConstruct() {
		return CoCreateFreeThreadedMarshaler(
			GetControllingUnknown(), &m_pUnkMarshaler.p);
	}

	void FinalRelease() {
		m_pUnkMarshaler.Release();
		if (m_hProcess)
			::CloseHandle(m_hProcess);
	}

	void SetHandle(HANDLE hProcess);

private:
	HANDLE m_hProcess{ nullptr };
	CComPtr<IUnknown> m_pUnkMarshaler;

	// Inherited via IWinProcess
	HRESULT get_Id(DWORD* pId);
	HRESULT get_ImagePath(BSTR* path);
	HRESULT Terminate(DWORD exitCode);
};

The two properties and one method look like this:

void CWinProcess::SetHandle(HANDLE hProcess) {
	m_hProcess = hProcess;
}

HRESULT CWinProcess::get_Id(DWORD* pId) {
	ATLASSERT(m_hProcess);
	return *pId = ::GetProcessId(m_hProcess), S_OK;
}

HRESULT CWinProcess::get_ImagePath(BSTR* pPath) {
	WCHAR path[MAX_PATH];
	DWORD size = _countof(path);
	if (::QueryFullProcessImageName(m_hProcess, 0, path, &size))
		return CComBSTR(path).CopyTo(pPath);

	return HRESULT_FROM_WIN32(::GetLastError());
}

HRESULT CWinProcess::Terminate(DWORD exitCode) {
	HANDLE hKill;
	if (::DuplicateHandle(::GetCurrentProcess(), m_hProcess, 
		::GetCurrentProcess(), &hKill, PROCESS_TERMINATE, FALSE, 0)) {
		auto success = ::TerminateProcess(hKill, exitCode);
		auto error = ::GetLastError();
		::CloseHandle(hKill);
		return success ? S_OK : HRESULT_FROM_WIN32(error);
	}
	return HRESULT_FROM_WIN32(::GetLastError());
}

The APIs used above are fairly straightforward and of course fully documented.

The last piece of the puzzle is the moniker’s class factory:

class ATL_NO_VTABLE CMonikerClassFactory : 
	public ATL::CComObjectRootEx<ATL::CComMultiThreadModel>,
	public IParseDisplayName {
public:
	BEGIN_COM_MAP(CMonikerClassFactory)
		COM_INTERFACE_ENTRY(IParseDisplayName)
	END_COM_MAP()

	// Inherited via IParseDisplayName
	HRESULT __stdcall ParseDisplayName(IBindCtx* pbc, LPOLESTR pszDisplayName, ULONG* pchEaten, IMoniker** ppmkOut) override;
};

Just one method to implement:

HRESULT __stdcall CMonikerClassFactory::ParseDisplayName(
    IBindCtx* pbc, LPOLESTR pszDisplayName, 
    ULONG* pchEaten, IMoniker** ppmkOut) {
    auto colon = wcschr(pszDisplayName, L':');
    ATLASSERT(colon);
    if (colon == nullptr)
        return E_INVALIDARG;

    //
    // simplistic, assume all display name consumed
    //
    *pchEaten = (ULONG)wcslen(pszDisplayName);

    CComObject<CProcessMoniker>* pMon;
    auto hr = pMon->CreateInstance(&pMon);
    if (FAILED(hr))
        return hr;

    //
    // provide the process ID
    //
    pMon->m_DisplayName = colon + 1;
    pMon->AddRef();
    hr = pMon->QueryInterface(ppmkOut);
    pMon->Release();
    return hr;
}

First, the colon is searched for, as the display name looks like “process:xxxx”. The “xxxx” part is stored in the resulting moniker, created with CComObject<>, similarly to the CWinProcess earlier. The pchEaten value reports back how many characters were consumed – the moniker factory should parse as much as it understands, because moniker composition may be in play. Hopefully, I’ll discuss that in a future post.

Finally, registration must be added for the moniker. Here is ProcessMoniker.rgs, where the lower part was added to connect the “process” ProgId/moniker name to the CLSID of the process moniker:

HKCR
{
	NoRemove CLSID
	{
		ForceRemove {6ea3a80e-2936-43be-8725-2e95896da9a4} = s 'ProcessMoniker class'
		{
			InprocServer32 = s '%MODULE%'
			{
				val ThreadingModel = s 'Both'
			}
			TypeLib = s '{97a86fc5-ffef-4e80-88a0-fa3d1b438075}'
			Version = s '1.0'
		}
	}
	process = s 'Process Moniker Class'
	{
		CLSID = s '{6ea3a80e-2936-43be-8725-2e95896da9a4}'
	}
}

And that is it. Here is an example client that terminates a process given its ID:

void Kill(DWORD pid) {
	std::wstring displayName(L"process:");
	displayName += std::to_wstring(pid);
	BIND_OPTS opts{ sizeof(opts) };
	CComPtr<IWinProcess> spProcess;
	auto hr = ::CoGetObject(displayName.c_str(), &opts, 
		__uuidof(IWinProcess), reinterpret_cast<void**>(&spProcess));
	if (SUCCEEDED(hr)) {
		auto hr = spProcess->Terminate(1);
		if (SUCCEEDED(hr))
			printf("Process %u terminated.\n", pid);
		else
			printf("Error terminating process: hr=0x%X\n", hr);
	}
}

All the code can be found in this Github repo: zodiacon/MonikerFun: Demonstrating a simple moniker. (github.com)

Here is VBScript example (this works because WinProcess implements IDispatch):

set process = GetObject("process:25520")
MsgBox process.ImagePath

How about .NET or PowerShell? Here is Powershell:

PS> $p = [System.Runtime.InteropServices.Marshal]::BindToMoniker("process:25520")
PS> $p | Get-Member                                                                                             

   TypeName: System.__ComObject#{3ab0471f-2635-429d-95e9-f2baede2859e}

Name      MemberType Definition
----      ---------- ----------
Terminate Method     void Terminate (uint)
Id        Property   uint Id () {get}
ImagePath Property   string ImagePath () {get}


PS> $p.ImagePath
C:\Windows\System32\notepad.exe

The DisplayWindows function just displays names of Explorer windows obtained by using IShellWindows:

void DisplayWindows(IShellWindows* pShell) {
	long count = 0;
	pShell->get_Count(&count);
	for (long i = 0; i < count; i++) {
		CComPtr<IDispatch> spDisp;
		pShell->Item(CComVariant(i), &spDisp);
		CComQIPtr<IWebBrowserApp> spWin(spDisp);
		if (spWin) {
			CComBSTR name;
			spWin->get_LocationName(&name);
			printf("Name: %ws\n", name.m_str);
		}
	}
}

Happy Moniker day!

Next Windows Kernel Programming Class

I’m happy to announce the next 5-day virtual Windows Kernel Programming class to be held in October. The syllabus for the class can be found here. A notable addition to the class is an introduction to the Kernel Mode Driver Framework (KMDF).

Dates and Times (all in October 2022), times based on London:
11 (full day): 4pm to 12am
12 (full day): 4pm to 12am
13 (half day): 4pm to 8pm
17 (half day): 4pm to 8pm
18 (full day): 4pm to 12am
19 (half day): 4pm to 8pm
20 (half day): 4pm to 8pm

The class will be recorded and provided to the participants.

Cost:
900 USD if paid by an individual
1700 USD if paid by a company
Previous participants of my classes get 10% off. Multiple participants from the same company get a discount as well (talk to me).

Registration
To register, send email to zodiacon@live.com and provide the name(s) and email(s) of the participant(s), the company name (if any), and your time zone (for my information, although I cannot change course times).

Feel free to contact me for any questions or comments via email, twitter (@zodiacon) or Linkedin.

Zombie Processes

The term “Zombie Process” in Windows is not an official one, as far as I know. Regardless, I’ll define zombie process to be a process that has exited (for whatever reason), but at least one reference remains to the kernel process object (EPROCESS), so that the process object cannot be destroyed.

How can we recognize zombie processes? Is this even important? Let’s find out.

All kernel objects are reference counted. The reference count includes the handle count (the number of open handles to the object), and a “pointer count”, the number of kernel clients to the object that have incremented its reference count explicitly so the object is not destroyed prematurely if all handles to it are closed.

Process objects are managed within the kernel by the EPROCESS (undocumented) structure, that contains or points to everything about the process – its handle table, image name, access token, job (if any), threads, address space, etc. When a process is done executing, some aspects of the process get destroyed immediately. For example, all handles in its handle table are closed; its address space is destroyed. General properties of the process remain, however, some of which only have true meaning once a process dies, such as its exit code.

Process enumeration tools such as Task Manager or Process Explorer don’t show zombie processes, simply because the process enumeration APIs (EnumProcesses, Process32First/Process32Next, the native NtQuerySystemInformation, and WTSEnumerateProcesses) don’t return these – they only return processes that can still run code. The kernel debugger, on the other hand, shows all processes, zombie or not when you type something like !process 0 0. Identifying zombie processes is easy – their handle table and handle count is shown as zero. Here is one example:

kd> !process ffffc986a505a080 0
PROCESS ffffc986a505a080
    SessionId: 1  Cid: 1010    Peb: 37648ff000  ParentCid: 0588
    DirBase: 16484cd000  ObjectTable: 00000000  HandleCount:   0.
    Image: smartscreen.exe

Any kernel object referenced by the process object remains alive as well – such as a job (if the process is part of a job), and the process primary token (access token object). We can get more details about the process by passing the detail level “1” in the !process command:

lkd> !process ffffc986a505a080 1
PROCESS ffffc986a505a080
    SessionId: 1  Cid: 1010    Peb: 37648ff000  ParentCid: 0588
    DirBase: 16495cd000  ObjectTable: 00000000  HandleCount:   0.
    Image: smartscreen.exe
    VadRoot 0000000000000000 Vads 0 Clone 0 Private 16. Modified 7. Locked 0.
    DeviceMap ffffa2013f24aea0
    Token                             ffffa20147ded060
    ElapsedTime                       1 Day 15:11:50.174
    UserTime                          00:00:00.000
    KernelTime                        00:00:00.015
    QuotaPoolUsage[PagedPool]         0
    QuotaPoolUsage[NonPagedPool]      0
    Working Set Sizes (now,min,max)  (17, 50, 345) (68KB, 200KB, 1380KB)
    PeakWorkingSetSize                2325
    VirtualSize                       0 Mb
    PeakVirtualSize                   2101341 Mb
    PageFaultCount                    2500
    MemoryPriority                    BACKGROUND
    BasePriority                      8
    CommitCharge                      20
    Job                               ffffc98672eea060

Notice the address space does not exist anymore (VadRoot is zero). The VAD (Virtual Address Descriptors) is a data structure managed as a balanced binary search tree that describes the address space of a process – which parts are committed, which parts are reserved, etc. No address space exists anymore. Other details of the process are still there as they are direct members of the EPROCESS structure, such as the kernel and user time the process has used, its start and exit times (not shown in the debugger’s output above).

We can ask the debugger to show the reference count of any kernel object by using the generic !object command, to be followed by !trueref if there are handles open to the object:

lkd> !object ffffc986a505a080
Object: ffffc986a505a080  Type: (ffffc986478ce380) Process
    ObjectHeader: ffffc986a505a050 (new version)
    HandleCount: 1  PointerCount: 32768
lkd> !trueref ffffc986a505a080
ffffc986a505a080: HandleCount: 1 PointerCount: 32768 RealPointerCount: 1

Clearly, there is a single handle open to the process and that’s the only thing keeping it alive.

One other thing that remains is the unique process ID (shown as Cid in the above output). Process and thread IDs are generated by using a private handle table just for this purpose. This explains why process and thread IDs are always multiples of four, just like handles. In fact, the kernel treats PIDs and TIDs with the HANDLE type, rather with something like ULONG. Since there is a limit to the number of handles in a process (16711680, the reason is not described here), that’s also the limit for the number of process and threads that could exist on a system. This is a rather large number, so probably not an issue from a practical perspective, but zombie processes still keep their PIDs “taken”, so it cannot be reused. This means that in theory, some code can create millions of processes, terminate them all, but not close the handles it receives back, and eventually new processes could not be created anymore because PIDs (and TIDs) run out. I don’t know what would happen then 🙂

Here is a simple loop to do something like that by creating and destroying Notepad processes but keeping handles open:

WCHAR name[] = L"notepad";
STARTUPINFO si{ sizeof(si) };
PROCESS_INFORMATION pi;
int i = 0;
for (; i < 1000000; i++) {	// use 1 million as an example
	auto created = ::CreateProcess(nullptr, name, nullptr, nullptr,
        FALSE, 0, nullptr, nullptr, &si, &pi);
	if (!created)
		break;
	::TerminateProcess(pi.hProcess, 100);
	printf("Index: %6d PID: %u\n", i + 1, pi.dwProcessId);
	::CloseHandle(pi.hThread);
}
printf("Total: %d\n", i);

The code closes the handle to the first thread in the process, as keeping it alive would create “Zombie Threads”, much like zombie processes – threads that can no longer run any code, but still exist because at least one handle is keeping them alive.

How can we get a list of zombie processes on a system given that the “normal” tools for process enumeration don’t show them? One way of doing this is to enumerate all the process handles in the system, and check if the process pointed by that handle is truly alive by calling WaitForSingleObject on the handle (of course the handle must first be duplicated into our process so it’s valid to use) with a timeout of zero – we don’t want to wait really. If the result is WAIT_OBJECT_0, this means the process object is signaled, meaning it exited – it’s no longer capable of running any code. I have incorporated that into my Object Explorer (ObjExp.exe) tool. Here is the basic code to get details for zombie processes (the code for enumerating handles is not shown but is available in the source code):

m_Items.clear();
m_Items.reserve(128);
std::unordered_map<DWORD, size_t> processes;
for (auto const& h : ObjectManager::EnumHandles2(L"Process")) {
	auto hDup = ObjectManager::DupHandle(
        (HANDLE)(ULONG_PTR)h->HandleValue , h->ProcessId, 
        SYNCHRONIZE | PROCESS_QUERY_LIMITED_INFORMATION);
	if (hDup && WAIT_OBJECT_0 == ::WaitForSingleObject(hDup, 0)) {
		//
		// zombie process
		//
		auto pid = ::GetProcessId(hDup);
		if (pid) {
			auto it = processes.find(pid);
			ZombieProcess zp;
			auto& z = it == processes.end() ? zp : m_Items[it->second];
			z.Pid = pid;
			z.Handles.push_back({ h->HandleValue, h->ProcessId });
			WCHAR name[MAX_PATH];
			if (::GetProcessImageFileName(hDup, 
                name, _countof(name))) {
				z.FullPath = 
                    ProcessHelper::GetDosNameFromNtName(name);
				z.Name = wcsrchr(name, L'\\') + 1;
			}
			::GetProcessTimes(hDup, 
                (PFILETIME)&z.CreateTime, (PFILETIME)&z.ExitTime, 
                (PFILETIME)&z.KernelTime, (PFILETIME)&z.UserTime);
			::GetExitCodeProcess(hDup, &z.ExitCode);
			if (it == processes.end()) {
				m_Items.push_back(std::move(z));
				processes.insert({ pid, m_Items.size() - 1 });
			}
		}
	}
	if (hDup)
		::CloseHandle(hDup);
}

The data structure built for each process and stored in the m_Items vector is the following:

struct HandleEntry {
	ULONG Handle;
	DWORD Pid;
};
struct ZombieProcess {
	DWORD Pid;
	DWORD ExitCode{ 0 };
	std::wstring Name, FullPath;
	std::vector<HandleEntry> Handles;
	DWORD64 CreateTime, ExitTime, KernelTime, UserTime;
};

The ObjectManager::DupHandle function is not shown, but it basically calls DuplicateHandle for the process handle identified in some process. if that works, and the returned PID is non-zero, we can go do the work. Getting the process image name is done with GetProcessImageFileName – seems simple enough, but this function gets the NT name format of the executable (something like \Device\harddiskVolume3\Windows\System32\Notepad.exe), which is good enough if only the “short” final image name component is desired. if the full image path is needed in Win32 format (e.g. “c:\Windows\System32\notepad.exe”), it must be converted (ProcessHelper::GetDosNameFromNtName). You might be thinking that it would be far simpler to call QueryFullProcessImageName and get the Win32 name directly – but this does not work, and the function fails. Internally, the NtQueryInformationProcess native API is called with ProcessImageFileNameWin32 in the latter case, which fails if the process is a zombie one.

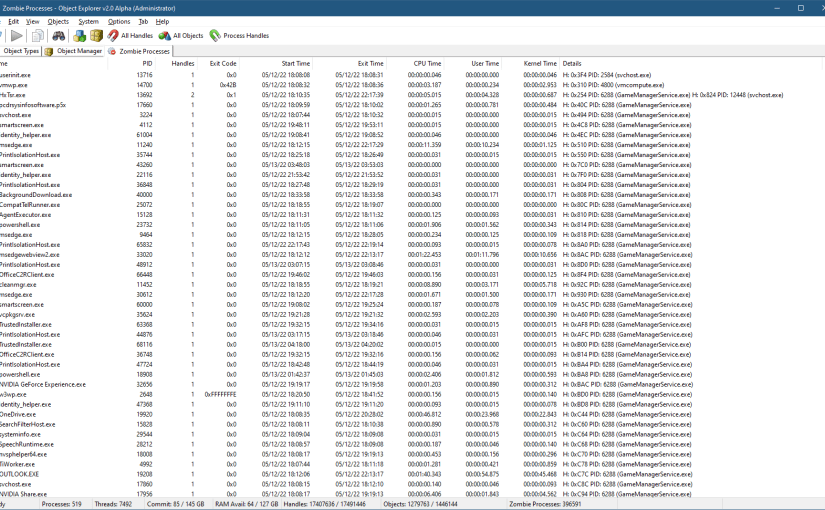
Running Object Explorer and selecting Zombie Processes from the System menu shows a list of all zombie processes (you should run it elevated for best results):

Object Explorer showing zombie processes

The above screenshot shows that many of the zombie processes are kept alive by GameManagerService.exe. This executable is from Razer running on my system. It definitely has a bug that keeps process handle alive way longer than needed. I’m not sure it would ever close these handles. Terminating this process will resolve the issue as the kernel closes all handles in a process handle table once the process terminates. This will allow all those processes that are held by that single handle to be freed from memory.

I plan to add Zombie Threads to Object Explorer – I wonder how many threads are being kept “alive” without good reason.

Mysteries of the Registry

The Windows Registry is one of the most recognized aspects of Windows. It’s a hierarchical database, storing information on a machine-wide basis and on a per-user basis… mostly. In this post, I’d like to examine the major parts of the Registry, including the “real” Registry.

Looking at the Registry is typically done by launching the built-in RegEdit.exe tool, which shows the five “hives” that seem to comprise the Registry:

RegEdit showing the main hives

These so-called “hives” provide some abstracted view of the information in the Registry. I’m saying “abstracted”, because not all of these are true hives. A true hive is stored in a file. The full hive list can be found in the Registry itself – at HKLM\SYSTEM\CurrentControlSet\Control\hivelist (I’ll abbreviate HKEY_LOCAL_MACHINE as HKLM), mapping an internal key name to the file where it’s stored (more on these “internal” key names will be discussed soon):

The hive list

Let’s examine the so-called “hives” as seen in the root RegEdit’s view.

  • HKEY_LOCAL_MACHINE is the simplest to understand. It contains machine-wide information, most of it stored in files (persistent). Some details related to hardware is built when the system initializes and is only kept in memory while the system is running. Such keys are volatile, since their contents disappear when the system is shut down.
    There are many interesting keys within HKLM, but my goal is not to go over every key (that would take a full book), but highlight a few useful pieces. HKLM\System\CurrentControlSet\Services is the key where all services and device drivers are installed. Note that “CurrentControlSet” is not a true key, but in fact is a link key, connecting it to something like HKLM\System\ControlSet001. The reason for this indirection is beyond the scope of this post. Regedit does not show this fact directly – there is no way to tell whether a key is a true key or just points to a different key. This is one reason I created Total Registry (formerly called Registry Explorer), that shows these kind of nuances:
TotalRegistry showing HKLM\System\CurrentControlSet

The liked key seems to have a weird name starting with \REGISTRY\MACHINE\. We’ll get to that shortly.

Other subkeys of note under HKLM include SOFTWARE, where installed applications store their system-level information; SAM and SECURITY, where local security policy and local accounts information are managed. These two subkeys contents is not not visible – even administrators don’t get access – only the SYSTEM account is granted access. One way to see what’s in these keys is to use psexec from Sysinternals to launch RegEdit or TotalRegistry under the SYSTEM account. Here is a command you can run in an elevated command window that will launch RegEdit under the SYSTEM account (if you’re using RegEdit, close it first):

psexec -s -i -d RegEdit

The -s switch indicates the SYSTEM account. -i is critical as to run the process in the interactive session (the default would run it in session 0, where no interactive user will ever see it). The -d switch is optional, and simply returns control to the console while the process is running, rather than waiting for the process to terminate.

The other way to gain access to the SAM and SECURITY subkeys is to use the “Take Ownership” privilege (easy to do when the Permissions dialog is open), and transfer the ownership to an admin user – the owner can specify who can do what with an object, and allow itself full access. Obviously, this is not a good idea in general, as it weakens security.

The BCD00000000 subkey contains the Boot Configuration Data (BCD), normally accessed using the bcdedit.exe tool.

  • HKEY_USERS – this is the other hive that truly stores data. Its subkeys contain user profiles for all users that ever logged in locally to this machine. Each subkey’s name is a Security ID (SID), in its string representation:
HKEY_USERS

There are 3 well-known SIDs, representing the SYSTEM (S-1-5-18), LocalService (S-1-5-19), and NetworkService (S-1-5-20) accounts. These are the typical accounts used for running Windows Services. “Normal” users get ugly SIDs, such as the one shown – that’s my user’s local SID. You may be wondering what is that “_Classes” suffix in the second key. We’ll get to that as well.

  • HKEY_CURRENT_USER is a link key, pointing to the user’s subkey under HKEY_USERS running the current process. Obviously, the meaning of “current user” changes based on the process access token looking at the Registry.
  • HKEY_CLASSES_ROOT is the most curious of the keys. It’s not a “real” key in the sense that it’s not a hive – not stored in a file. It’s not a link key, either. This key is a “combination” of two keys: HKLM\Software\Classes and HKCU\Software\Classes. In other words, the information in HKEY_CLASSES_ROOT is coming from the machine hive first, but can be overridden by the current user’s hive.
    What information is there anyway? The first thing is shell-related information, such as file extensions and associations, and all other information normally used by Explorer.exe. The second thing is information related to the Component Object Model (COM). For example, the CLSID subkey holds COM class registration (GUIDs you can pass to CoCreateInstance to (potentially) create a COM object of that class). Looking at the CLSID subkey under HKLM\Software\Classes shows there are 8160 subkeys, or roughly 8160 COM classes registered on my system from HKLM:
HKLM\Software\Classes

Looking at the same key under HKEY_CURRENT_USER tells a different story:

HKCU\Software\Classes

Only 46 COM classes provide extra or overridden registrations. HKEY_CLASSES_ROOT combines both, and uses HKCU in case of a conflict (same key name). This explains the extra “_Classes” subkey within the HKEY_USERS key – it stores the per user stuff (in the file UsrClasses.dat in something like c:\Users\<username>\AppData\Local\Microsoft\Windows).

  • HKEY_CURRENT_CONFIG is a link to HKLM\SYSTEM\CurrentControlSet\Hardware\Profiles\Current

    The list of “standard” hives (the hives accessible by official Windows APIs such as RegOpenKeyEx contains some more that are not shown by Regedit. They can be viewed by TotalReg if the option “Extra Hives” is selected in the View menu. At this time, however, the tool needs to be restarted for this change to take effect (I just didn’t get around to implementing the change dynamically, as it was low on my priority list). Here are all the hives accessible with the official Windows API:
All hives

I’ll let the interested reader to dig further into these “extra” hives. On of these hives deserves special mentioning – HKEY_PERFORMANCE_DATA – it was used in the pre Windows 2000 days as a way to access Performance Counters. Registry APIs had to be used at the time. Fortunately, starting from Windows 2000, a new dedicated API is provided to access Performance Counters (functions starting with Pdh* in <pdh.h>).

Is this it? Is this the entire Registry? Not quite. As you can see in TotalReg, there is a node called “Registry”, that tells yet another story. Internally, all Registry keys are rooted in a single key called REGISTRY. This is the only named Registry key. You can see it in the root of the Object Manager’s namespace with WinObj from Sysinternals:

WinObj from Sysinternals showing the Registry key object

Here is the object details in a Local Kernel debugger:

lkd> !object \registry
Object: ffffe00c8564c860  Type: (ffff898a519922a0) Key
    ObjectHeader: ffffe00c8564c830 (new version)
    HandleCount: 1  PointerCount: 32770
    Directory Object: 00000000  Name: \REGISTRY
lkd> !trueref ffffe00c8564c860
ffffe00c8564c860: HandleCount: 1 PointerCount: 32770 RealPointerCount: 3

All other Registry keys are based off of that root key, the Configuration Manager (the kernel component in charge of the Registry) parses the remaining path as expected. This is the real Registry. The official Windows APIs cannot use this path format, but native APIs can. For example, using NtOpenKey (documented as ZwOpenKey in the Windows Driver Kit, as this is a system call) allows such access. This is how TotalReg is able to look at the real Registry.

Clearly, the normal user-mode APIs somehow map the “standard” hive path to the real Registry path. The simplest is the mapping of HKEY_LOCAL_MACHINE to \REGISTRY\MACHINE. Another simple one is HKEY_USERS mapped to \REGISTRY\USER. HKEY_CURRENT_USER is a bit more complex, and needs to be mapped to the per-user hive under \REGISTRY\USER. The most complex is our friend HKEY_CLASSES_ROOT – there is no simple mapping – the APIs have to check if there is per-user override or not, etc.

Lastly, it seems there are keys in the real Registry that cannot be reached from the standard Registry at all:

The real Registry

There is a key named “A” which seems inaccessible. This key is used for private keys in processes, very common in Universal Windows Application (UWP) processes, but can be used in other processes as well. They are not accessible generally, not even with kernel code – the Configuration Manager prevents it. You can verify their existence by searching for \Registry\A in tools like Process Explorer or TotalReg itself (by choosing Scan Key Handles from the Tools menu). Here is TotalReg, followed by Process Explorer:

TotalReg key handles
Process Explorer key handles

Finally, the WC key is used for Windows Container, internally called Silos. A container (like the ones created by Docker) is an isolated instance of a user-mode OS, kind of like a lightweight virtual machine, but the kernel is not separate (as would be with a true VM), but is provided by the host. Silos are very interesting, but outside the scope of this post.

Briefly, there are two main Silo types: An Application Silo, which is not a true container, and mostly used with application based on the Desktop Bridge technology. A classic example is WinDbg Preview. The second type is Server Silo, which is a true container. A true container must have its file system, Registry, and Object Manager namespace virtualized. This is exactly the role of the WC subkeys – provide the private Registry keys for containers. The Configuration Manager (as well as other parts of the kernel) are Silo-aware, and will redirect Registry calls to the correct subkey, having no effect on the Host Registry or the private Registry of other Silos.

You can examine some aspects of silos with the kernel debugger !silo command. Here is an example from a server 2022 running a Server Silo and the Registry keys under WC:

lkd> !silo
		Address          Type       ProcessCount Identifier
		ffff800f2986c2e0 ServerSilo 15           {1d29488c-bccd-11ec-a503-d127529101e4} (0n732)
1 active Silo(s)
lkd> !silo ffff800f2986c2e0

Silo ffff800f2986c2e0:
		Job               : ffff800f2986c2e0
		Type              : ServerSilo
		Identifier        : {1d29488c-bccd-11ec-a503-d127529101e4} (0n732)
		Processes         : 15

Server silo globals ffff800f27e65a40:
		Default Error Port: ffff800f234ee080
		ServiceSessionId  : 217
		Root Directory    : 00007ffcad26b3e1 '\Silos\732'
		State             : Running
A Server Silo’s keys

There you have it. The relatively simple-looking Registry shown in RegEdit is viewed differently by the kernel. Device driver writers find this out relatively early – they cannot use the “abstractions” provided by user mode even if these are sometimes convenient.