Window Stations and Desktops

A while back I blogged about the differences between the virtual desktop feature exposed to users on Windows 10/11, and the Desktops tool from Sysinternals. In this post, I’d like to shed some more light on Window Stations, desktops, and windows. I assume you have read the aforementioned blog post before continuing.

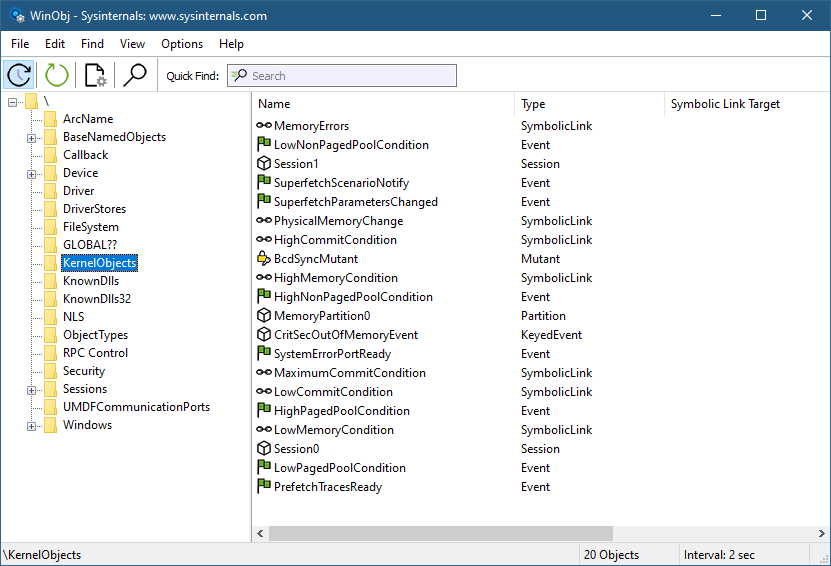
We know that Window Stations are contained in sessions. Can we enumerate these? The EnumWindowStations API is available in the Windows API, but it only returns the Windows Stations in the current session. There is no “EnumSessionWindowStations”. Window Stations, however, are named objects, and so are visible in tools such as WinObj (running elevated):

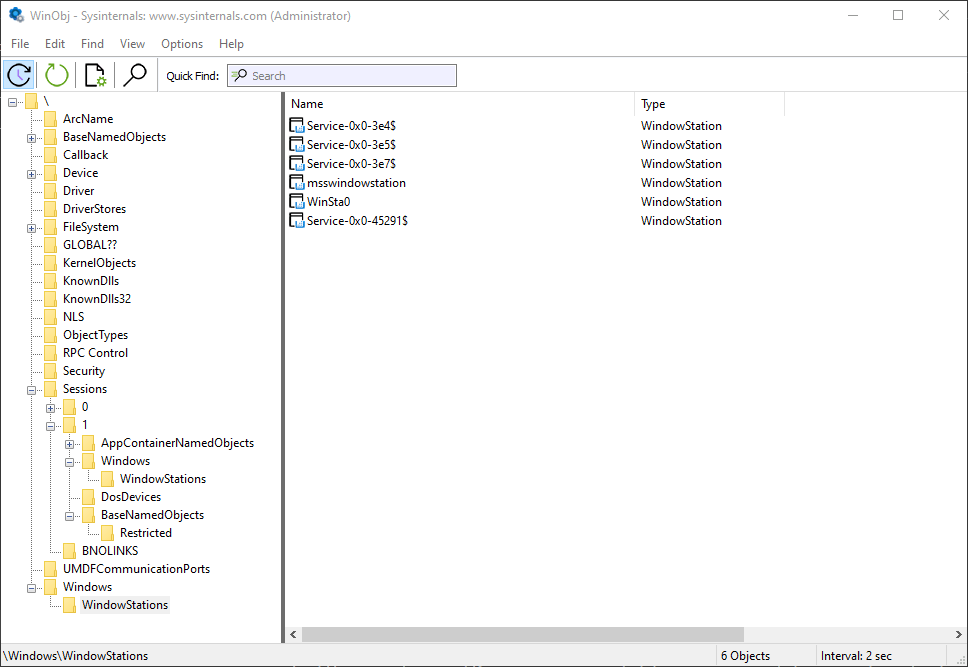
Window stations in session 0

The Window Stations in session 0 are at \Windows\WindowStations
The Window Stations in session x are at \Sessions\x\Windows\WindowStations

The OpenWindowStation API only accepts a “local” name, under the callers session. The native NtUserOpenWindowStation API (from Win32u.dll) is more flexible, accepting a full object name:

HWINSTA NtUserOpenWindowStation(POBJECT_ATTRIBUTES attr, ACCESS_MASK access);

Here is an example that opens the “msswindowstation” Window Station:

#include <Windows.h>
#include <winternl.h>

#pragma comment(lib, "ntdll")

HWINSTA NTAPI _NtUserOpenWindowStation(_In_ POBJECT_ATTRIBUTES attr, _In_ ACCESS_MASK access);
int main() {
	// force Win32u.DLL to load
	::LoadLibrary(L"user32");
	auto NtUserOpenWindowStation = (decltype(_NtUserOpenWindowStation)*)
		::GetProcAddress(::GetModuleHandle(L"win32u"), "NtUserOpenWindowStation");

	UNICODE_STRING winStaName;
	RtlInitUnicodeString(&winStaName, L"\\Windows\\WindowStations\\msswindowstation");
	OBJECT_ATTRIBUTES winStaAttr;
	InitializeObjectAttributes(&winStaAttr, &winStaName, 0, nullptr, nullptr);
	auto hWinSta = NtUserOpenWindowStation(&winStaAttr, READ_CONTROL);
	if (hWinSta) {
        // do something with hWinSta
        ::CloseWindowStation(hWinSta);
    }

You may or may not have enough power to open a handle with the required access – depending on the Window Station in question. Those in session 0 are hardly accessible from non-session 0 processes, even with the SYSTEM account. You can examine their security descriptor with the kernel debugger (as other tools will return access denied):

lkd> !object \Windows\WindowStations\msswindowstation
Object: ffffe103f5321c00  Type: (ffffe103bb0f0ae0) WindowStation
    ObjectHeader: ffffe103f5321bd0 (new version)
    HandleCount: 4  PointerCount: 98285
    Directory Object: ffff808433e412b0  Name: msswindowstation
lkd> dt nt!_OBJECT_HEADER ffffe103f5321bd0

   +0x000 PointerCount     : 0n98285
   +0x008 HandleCount      : 0n4
   +0x008 NextToFree       : 0x00000000`00000004 Void
   +0x010 Lock             : _EX_PUSH_LOCK
   +0x018 TypeIndex        : 0xa2 ''
   +0x019 TraceFlags       : 0 ''
   +0x019 DbgRefTrace      : 0y0
   +0x019 DbgTracePermanent : 0y0
   +0x01a InfoMask         : 0xe ''
   +0x01b Flags            : 0 ''
   +0x01b NewObject        : 0y0
   +0x01b KernelObject     : 0y0
   +0x01b KernelOnlyAccess : 0y0
   +0x01b ExclusiveObject  : 0y0
   +0x01b PermanentObject  : 0y0
   +0x01b DefaultSecurityQuota : 0y0
   +0x01b SingleHandleEntry : 0y0
   +0x01b DeletedInline    : 0y0
   +0x01c Reserved         : 0
   +0x020 ObjectCreateInfo : 0xfffff801`21c53940 _OBJECT_CREATE_INFORMATION
   +0x020 QuotaBlockCharged : 0xfffff801`21c53940 Void
   +0x028 SecurityDescriptor : 0xffff8084`3da8aa6c Void
   +0x030 Body             : _QUAD
lkd> !sd 0xffff8084`3da8aa60
->Revision: 0x1
->Sbz1    : 0x0
->Control : 0x8014
            SE_DACL_PRESENT
            SE_SACL_PRESENT
            SE_SELF_RELATIVE
->Owner   : S-1-5-18
->Group   : S-1-5-18
->Dacl    : 
->Dacl    : ->AclRevision: 0x2
->Dacl    : ->Sbz1       : 0x0
->Dacl    : ->AclSize    : 0x1c
->Dacl    : ->AceCount   : 0x1
->Dacl    : ->Sbz2       : 0x0
->Dacl    : ->Ace[0]: ->AceType: ACCESS_ALLOWED_ACE_TYPE
->Dacl    : ->Ace[0]: ->AceFlags: 0x0
->Dacl    : ->Ace[0]: ->AceSize: 0x14
->Dacl    : ->Ace[0]: ->Mask : 0x0000011b
->Dacl    : ->Ace[0]: ->SID: S-1-1-0

You can become SYSTEM to help with access by using PsExec from Sysinternals to launch a command window (or whatever) as SYSTEM but still run in the interactive session:

psexec -s -i -d cmd.exe

If all else fails, you may need to use the “Take Ownership” privilege to make yourself the owner of the object and change its DACL to allow yourself full access. Apparently, even that won’t work, as getting something from a Window Station in another session seems to be blocked (see replies in Twitter thread). READ_CONTROL is available to get some basic info.

Here is a screenshot of Object Explorer running under SYSTEM that shows some details of the “msswindowstation” Window Station:

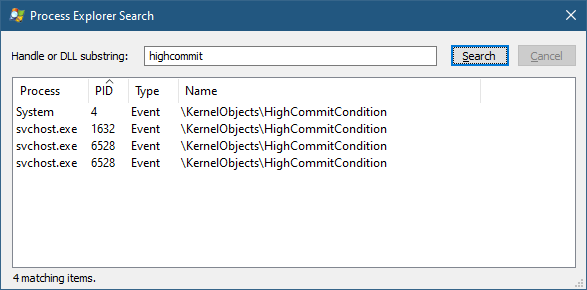
Guess which processes hold handles to this hidden Windows Station?

Once you are able to get a Window Station handle, you may be able to go one step deeper by enumerating desktops, if you managed to get at least WINSTA_ENUMDESKTOPS access mask:

::EnumDesktops(hWinSta, [](auto deskname, auto param) -> BOOL {
	printf(" Desktop: %ws\n", deskname);
	auto h = (HWINSTA)param;
	return TRUE;
	}, (LPARAM)hWinSta);

Going one level deeper, you can enumerate the top-level windows in each desktop (if any). For that you will need to connect the process to the Window Station of interest and then call EnumDesktopWindows:

void DoEnumDesktopWindows(HWINSTA hWinSta, PCWSTR name) {
	if (::SetProcessWindowStation(hWinSta)) {
		auto hdesk = ::OpenDesktop(name, 0, FALSE, DESKTOP_READOBJECTS);
		if (!hdesk) {
			printf("--- failed to open desktop %ws (%d)\n", name, ::GetLastError());
			return;
		}
		static WCHAR pname[MAX_PATH];
		::EnumDesktopWindows(hdesk, [](auto hwnd, auto) -> BOOL {
			static WCHAR text[64];
			if (::IsWindowVisible(hwnd) && ::GetWindowText(hwnd, text, _countof(text)) > 0) {
				DWORD pid;
				auto tid = ::GetWindowThreadProcessId(hwnd, &pid);
				auto hProcess = ::OpenProcess(PROCESS_QUERY_LIMITED_INFORMATION, FALSE, pid);
				BOOL exeNameFound = FALSE;
				PWSTR exeName = nullptr;
				if (hProcess) {
					DWORD size = MAX_PATH;
					exeNameFound = ::QueryFullProcessImageName(hProcess, 0, pname, &size);
					::CloseHandle(hProcess);
					if (exeNameFound) {
						exeName = ::wcsrchr(pname, L'\\');
						if (exeName == nullptr)
							exeName = pname;
						else
							exeName++;
					}
				}
				printf("  HWND: 0x%08X PID: 0x%X (%d) %ws TID: 0x%X (%d): %ws\n", 
					(DWORD)(DWORD_PTR)hwnd, pid, pid, 
					exeNameFound ? exeName : L"", tid, tid, text);
			}
			return TRUE;
			}, 0);
		::CloseDesktop(hdesk);
	}
}

Calling SetProcessWindowStation can only work with a Windows Station that belongs to the current session.

Here is an example output for the interactive session (Window Stations enumerated with EnumWindowStations):

Window station: WinSta0
 Desktop: Default
  HWND: 0x00010E38 PID: 0x4D04 (19716) Zoom.exe TID: 0x5FF8 (24568): ZPToolBarParentWnd
  HWND: 0x000A1C7A PID: 0xB804 (47108) VsDebugConsole.exe TID: 0xDB50 (56144): D:\Dev\winsta\x64\Debug\winsta.exe
  HWND: 0x00031DE8 PID: 0xBF40 (48960) devenv.exe TID: 0x94E8 (38120): winsta - Microsoft Visual Studio Preview
  HWND: 0x00031526 PID: 0x1384 (4996) msedge.exe TID: 0xE7C (3708): zodiacon/ObjectExplorer: Explore Kernel Objects on Windows and
  HWND: 0x00171A9A PID: 0xA40C (41996)  TID: 0x9C08 (39944): WindowStation (\Windows\WindowStations\msswindowstation)
  HWND: 0x000319D0 PID: 0xA40C (41996)  TID: 0x9C08 (39944): Object Manager - Object Explorer 2.0.2.0 (Administrator)
  HWND: 0x001117DC PID: 0x253C (9532) ObjExp.exe TID: 0x9E10 (40464): Object Manager - Object Explorer 2.0.2.0 (Administrator)
  HWND: 0x00031CA8 PID: 0xBE5C (48732) devenv.exe TID: 0xC250 (49744): OpenWinSta - Microsoft Visual Studio Preview (Administrator)
  HWND: 0x000B1884 PID: 0xA8A0 (43168) DbgX.Shell.exe TID: 0xA668 (42600):  - KD '', Local Connection  - WinDbg 1.2306.12001.0 (Administra
...
  HWND: 0x000101C8 PID: 0x3598 (13720) explorer.exe TID: 0x359C (13724): Program Manager
Window station: Service-0x0-45193$
 Desktop: sbox_alternate_desktop_0x6A80
 Desktop: sbox_alternate_desktop_0xA94C
 Desktop: sbox_alternate_desktop_0x3D8C
 Desktop: sbox_alternate_desktop_0x7EF8
 Desktop: sbox_alternate_desktop_0x72FC
 Desktop: sbox_alternate_desktop_0x27B4
 Desktop: sbox_alternate_desktop_0x6E80
 Desktop: sbox_alternate_desktop_0x6C54
 Desktop: sbox_alternate_desktop_0x68C8
 Desktop: sbox_alternate_desktop_0x691C
 Desktop: sbox_alternate_desktop_0x4150
 Desktop: sbox_alternate_desktop_0x6254
 Desktop: sbox_alternate_desktop_0x5B9C
 Desktop: sbox_alternate_desktop_0x59B4
 Desktop: sbox_alternate_desktop_0x1384
 Desktop: sbox_alternate_desktop_0x5480

The desktops in the Window Station “Service-0x0-45193$” above don’t seem to have top-level visible windows.

You can also access the clipboard and atom table of a given Windows Station, if you have a powerful enough handle. I’ll leave that as an exercise as well.

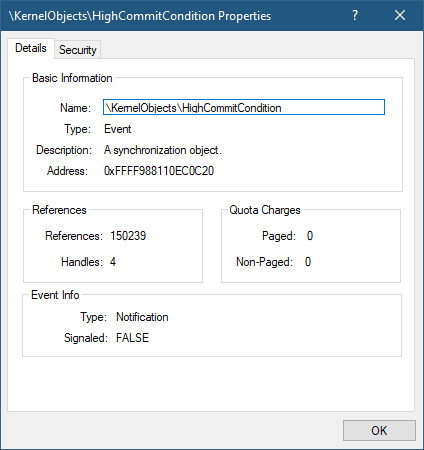
Finally, what about session enumeration? That’s the easy part – no need to call NtOpenSession with Session objects that can be found in the “\KernelObjects” directory in the Object Manager’s namespace – the WTS family of functions can be used. Specifically, WTSEnumerateSessionsEx can provide some important properties of a session:

void EnumSessions() {
	DWORD level = 1;
	PWTS_SESSION_INFO_1 info;
	DWORD count = 0;
	::WTSEnumerateSessionsEx(WTS_CURRENT_SERVER_HANDLE, &level, 0, &info, &count);
	for (DWORD i = 0; i < count; i++) {
		auto& data = info[i];
		printf("Session %d (%ws) Username: %ws\\%ws State: %s\n", data.SessionId, data.pSessionName, 
			data.pDomainName ? data.pDomainName : L"NT AUTHORITY", data.pUserName ? data.pUserName : L"SYSTEM", 
			StateToString((WindowStationState)data.State));
    }
	::WTSFreeMemory(info);
}

What about creating a process to use a different Window Station and desktop? One member of the STARTUPINFO structure passed to CreateProcess (lpDesktop) allows setting a desktop name and an optional Windows Station name separated by a backslash (e.g. “MyWinSta\MyDesktop”).

There is more to Window Stations and Desktops that meets the eye… this should give interested readers a head start in doing further research.

Levels of Kernel Debugging

Doing any kind of research into the Windows kernel requires working with a kernel debugger, mostly WinDbg (or WinDbg Preview). There are at least 3 “levels” of debugging the kernel.

Level 1: Local Kernel Debugging

The first is using a local kernel debugger, which means configuring WinDbg to look at the kernel of the local machine. This can be configured by running the following command in an elevated command window, and restarting the system:

bcdedit -debug on

You must disable Secure Boot (if enabled) for this command to work, as Secure Boot protects against putting the machine in local kernel debugging mode. Once the system is restarted, WinDbg launched elevated, select File/Kernel Debug and go with the “Local” option (WinDbg Preview shown):

If all goes well, you’ll see the “lkd>” prompt appearing, confirming you’re in local kernel debugging mode.

What can you in this mode? You can look at anything in kernel and user space, such as listing the currently existing processes (!process 0 0), or examining any memory location in kernel or user space. You can even change kernel memory if you so desire, but be careful, any “bad” change may crash your system.

The downside of local kernel debugging is that the system is a moving target, things change while you’re typing commands, so you don’t want to look at things that change quickly. Additionally, you cannot set any breakpoint; you cannot view any CPU registers, since these are changing constantly, and are on a CPU-basis anyway.

The upside of local kernel debugging is convenience – setting it up is very easy, and you can still get a lot of information with this mode.

Level 2: Remote Debugging of a Virtual Machine

The next level is a full kernel debugging experience of a virtual machine, which can be running locally on your host machine, or perhaps on another host somewhere. Setting this up is more involved. First, the target VM must be set up to allow kernel debugging and set the “interface” to the host debugger. Windows supports several interfaces, but for a VM the best to use is network (supported on Windows 8 and later).

First, go to the VM and ping the host to find out its IP address. Then type the following:

bcdedit /dbgsettings net hostip:172.17.32.1 port:55000 key:1.2.3.4

Replace the host IP with the correct address, and select an unused port on the host. The key can be left out, in which case the command will generate something for you. Since that key is needed on the host side, it’s easier to select something simple. If the target VM is not local, you might prefer to let the command generate a random key and use that.

Next, launch WinDbg elevated on the host, and attach to the kernel using the “Net” option, specifying the correct port and key:

Restart the target, and it should connect early in its boot process:

Microsoft (R) Windows Debugger Version 10.0.25200.1003 AMD64
Copyright (c) Microsoft Corporation. All rights reserved.

Using NET for debugging
Opened WinSock 2.0
Waiting to reconnect...
Connected to target 172.29.184.23 on port 55000 on local IP 172.29.176.1.
You can get the target MAC address by running .kdtargetmac command.
Connected to Windows 10 25309 x64 target at (Tue Mar  7 11:38:18.626 2023 (UTC - 5:00)), ptr64 TRUE
Kernel Debugger connection established.  (Initial Breakpoint requested)

************* Path validation summary **************
Response                         Time (ms)     Location
Deferred                                       SRV*d:\Symbols*https://msdl.microsoft.com/download/symbols
Symbol search path is: SRV*d:\Symbols*https://msdl.microsoft.com/download/symbols
Executable search path is: 
Windows 10 Kernel Version 25309 MP (1 procs) Free x64
Edition build lab: 25309.1000.amd64fre.rs_prerelease.230224-1334
Machine Name:
Kernel base = 0xfffff801`38600000 PsLoadedModuleList = 0xfffff801`39413d70
System Uptime: 0 days 0:00:00.382
nt!DebugService2+0x5:
fffff801`38a18655 cc              int     3

Enter the g command to let the system continue. The prompt is “kd>” with the current CPU number on the left. You can break at any point into the target by clicking the “Break” toolbar button in the debugger. Then you can set up breakpoints, for whatever you’re researching. For example:

1: kd> bp nt!ntWriteFile
1: kd> g
Breakpoint 0 hit
nt!NtWriteFile:
fffff801`38dccf60 4c8bdc          mov     r11,rsp
2: kd> k
 # Child-SP          RetAddr               Call Site
00 fffffa03`baa17428 fffff801`38a81b05     nt!NtWriteFile
01 fffffa03`baa17430 00007ff9`1184f994     nt!KiSystemServiceCopyEnd+0x25
02 00000095`c2a7f668 00007ff9`0ec89268     0x00007ff9`1184f994
03 00000095`c2a7f670 0000024b`ffffffff     0x00007ff9`0ec89268
04 00000095`c2a7f678 00000095`c2a7f680     0x0000024b`ffffffff
05 00000095`c2a7f680 0000024b`00000001     0x00000095`c2a7f680
06 00000095`c2a7f688 00000000`000001a8     0x0000024b`00000001
07 00000095`c2a7f690 00000095`c2a7f738     0x1a8
08 00000095`c2a7f698 0000024b`af215dc0     0x00000095`c2a7f738
09 00000095`c2a7f6a0 0000024b`0000002c     0x0000024b`af215dc0
0a 00000095`c2a7f6a8 00000095`c2a7f700     0x0000024b`0000002c
0b 00000095`c2a7f6b0 00000000`00000000     0x00000095`c2a7f700
2: kd> .reload /user
Loading User Symbols
.....................
2: kd> k
 # Child-SP          RetAddr               Call Site
00 fffffa03`baa17428 fffff801`38a81b05     nt!NtWriteFile
01 fffffa03`baa17430 00007ff9`1184f994     nt!KiSystemServiceCopyEnd+0x25
02 00000095`c2a7f668 00007ff9`0ec89268     ntdll!NtWriteFile+0x14
03 00000095`c2a7f670 00007ff9`08458dda     KERNELBASE!WriteFile+0x108
04 00000095`c2a7f6e0 00007ff9`084591e6     icsvc!ICTransport::PerformIoOperation+0x13e
05 00000095`c2a7f7b0 00007ff9`08457848     icsvc!ICTransport::Write+0x26
06 00000095`c2a7f800 00007ff9`08452ea3     icsvc!ICEndpoint::MsgTransactRespond+0x1f8
07 00000095`c2a7f8b0 00007ff9`08452abc     icsvc!ICTimeSyncReferenceMsgHandler+0x3cb
08 00000095`c2a7faf0 00007ff9`084572cf     icsvc!ICTimeSyncMsgHandler+0x3c
09 00000095`c2a7fb20 00007ff9`08457044     icsvc!ICEndpoint::HandleMsg+0x11b
0a 00000095`c2a7fbb0 00007ff9`084574c1     icsvc!ICEndpoint::DispatchBuffer+0x174
0b 00000095`c2a7fc60 00007ff9`08457149     icsvc!ICEndpoint::MsgDispatch+0x91
0c 00000095`c2a7fcd0 00007ff9`0f0344eb     icsvc!ICEndpoint::DispatchThreadFunc+0x9
0d 00000095`c2a7fd00 00007ff9`0f54292d     ucrtbase!thread_start<unsigned int (__cdecl*)(void *),1>+0x3b
0e 00000095`c2a7fd30 00007ff9`117fef48     KERNEL32!BaseThreadInitThunk+0x1d
0f 00000095`c2a7fd60 00000000`00000000     ntdll!RtlUserThreadStart+0x28
2: kd> !process -1 0
PROCESS ffffc706a12df080
    SessionId: 0  Cid: 0828    Peb: 95c27a1000  ParentCid: 044c
    DirBase: 1c57f1000  ObjectTable: ffffa50dfb92c880  HandleCount: 123.
    Image: svchost.exe

In this “level” of debugging you have full control of the system. When in a breakpoint, nothing is moving. You can view register values, call stacks, etc., without anything changing “under your feet”. This seems perfect, so do we really need another level?

Some aspects of a typical kernel might not show up when debugging a VM. For example, looking at the list of interrupt service routines (ISRs) with the !idt command on my Hyper-V VM shows something like the following (truncated):

2: kd> !idt

Dumping IDT: ffffdd8179e5f000

00:	fffff80138a79800 nt!KiDivideErrorFault
01:	fffff80138a79b40 nt!KiDebugTrapOrFault	Stack = 0xFFFFDD8179E95000
02:	fffff80138a7a140 nt!KiNmiInterrupt	Stack = 0xFFFFDD8179E8D000
03:	fffff80138a7a6c0 nt!KiBreakpointTrap
...
2e:	fffff80138a80e40 nt!KiSystemService
2f:	fffff80138a75750 nt!KiDpcInterrupt
30:	fffff80138a733c0 nt!KiHvInterrupt
31:	fffff80138a73720 nt!KiVmbusInterrupt0
32:	fffff80138a73a80 nt!KiVmbusInterrupt1
33:	fffff80138a73de0 nt!KiVmbusInterrupt2
34:	fffff80138a74140 nt!KiVmbusInterrupt3
35:	fffff80138a71d88 nt!HalpInterruptCmciService (KINTERRUPT ffffc70697f23900)

36:	fffff80138a71d90 nt!HalpInterruptCmciService (KINTERRUPT ffffc70697f23a20)

b0:	fffff80138a72160 ACPI!ACPIInterruptServiceRoutine (KINTERRUPT ffffdd817a1ecdc0)
...

Some things are missing, such as the keyboard interrupt handler. This is due to certain things handled “internally” as the VM is “enlightened”, meaning it “knows” it’s a VM. Normally, it’s a good thing – you get nice support for copy/paste between the VM and the host, seamless mouse and keyboard interaction, etc. But it does mean it’s not the same as another physical machine.

Level 3: Remote debugging of a physical machine

In this final level, you’re debugging a physical machine, which provides the most “authentic” experience. Setting this up is the trickiest. Full description of how to set it up is described in the debugger documentation. In general, it’s similar to the previous case, but network debugging might not work for you depending on the network card type your target and host machines have.

If network debugging is not supported because of the limited list of network cards supported, your best bet is USB debugging using a dedicated USB cable that you must purchase. The instructions to set up USB debugging are provided in the docs, but it may require some trial and error to locate the USB ports that support debugging (not all do). Once you have that set up, you’ll use the “USB” tab in the kernel attachment dialog on the host. Once connected, you can set breakpoints in ISRs that may not exist on a VM:

: kd> !idt

Dumping IDT: fffff8022f5b1000

00:	fffff80233236100 nt!KiDivideErrorFault
...
80:	fffff8023322cd70 i8042prt!I8042KeyboardInterruptService (KINTERRUPT ffffd102109c0500)
...
Dumping Secondary IDT: ffffe5815fa0e000 

01b0:hidi2c!OnInterruptIsr (KMDF) (KINTERRUPT ffffd10212e6edc0)

0: kd> bp i8042prt!I8042KeyboardInterruptService
0: kd> g
Breakpoint 0 hit
i8042prt!I8042KeyboardInterruptService:
fffff802`6dd42100 4889542410      mov     qword ptr [rsp+10h],rdx
0: kd> k
 # Child-SP          RetAddr               Call Site
00 fffff802`2f5cdf48 fffff802`331453cb     i8042prt!I8042KeyboardInterruptService
01 fffff802`2f5cdf50 fffff802`3322b25f     nt!KiCallInterruptServiceRoutine+0x16b
02 fffff802`2f5cdf90 fffff802`3322b527     nt!KiInterruptSubDispatch+0x11f
03 fffff802`2f5be9f0 fffff802`3322e13a     nt!KiInterruptDispatch+0x37
04 fffff802`2f5beb80 00000000`00000000     nt!KiIdleLoop+0x5a

Happy debugging!

Upcoming COM Programming Class

Today I’m happy to announce the next COM Programming class to be held in February 2023. The syllabus for the 3 day class can be found here. The course will be delivered in 6 half-days (4 hours each).

Dates: February (7, 8, 9, 14, 15, 16).
Times: 11am to 3pm EST (8am to 12pm PST) (4pm to 8pm UT)
Cost: 750 USD (if paid by an individual), 1400 USD (if paid by a company).

Half days should make it comfortable enough even if you’re not in an ideal time zone.

The class will be conducted remotely using Microsoft Teams.

What you need to know before the class: You should be comfortable using Windows on a Power User level. Concepts such as processes, threads, DLLs, and virtual memory should be understood fairly well. You should have experience writing code in C and some C++. You don’t have to be an expert, but you must know C and basic C++ to get the most out of this class. In case you have doubts, talk to me.

Participants in my Windows Internals and Windows System Programming classes have the required knowledge for the class.

We’ll start by looking at why COM was created in the first place, and then build clients and servers, digging into various mechanisms COM provides. See the syllabus for more details.

Previous students in my classes get 10% off. Multiple participants from the same company get a discount (email me for the details).

To register, send an email to zodiacon@live.com with the title “COM Programming Training”, and write the name(s), email(s) and time zone(s) of the participants.

Next Windows Kernel Programming Class

I’m happy to announce the next 5-day virtual Windows Kernel Programming class to be held in October. The syllabus for the class can be found here. A notable addition to the class is an introduction to the Kernel Mode Driver Framework (KMDF).

Dates and Times (all in October 2022), times based on London:
11 (full day): 4pm to 12am
12 (full day): 4pm to 12am
13 (half day): 4pm to 8pm
17 (half day): 4pm to 8pm
18 (full day): 4pm to 12am
19 (half day): 4pm to 8pm
20 (half day): 4pm to 8pm

The class will be recorded and provided to the participants.

Cost:
900 USD if paid by an individual
1700 USD if paid by a company
Previous participants of my classes get 10% off. Multiple participants from the same company get a discount as well (talk to me).

Registration
To register, send email to zodiacon@live.com and provide the name(s) and email(s) of the participant(s), the company name (if any), and your time zone (for my information, although I cannot change course times).

Feel free to contact me for any questions or comments via email, twitter (@zodiacon) or Linkedin.

Next Windows Internals Training

I am announcing the next 5 day Windows Internals remote training to be held in January 2022, starting on the 24th according to the followng schedule:

  • Jan 24 – 2pm to 10pm (all times are based on London time)
  • Jan 25, 26, 27 – 2pm to 6pm
  • Jan 31 – 2pm to 10pm
  • Feb 1, 2, 3 – 2pm to 6pm

The syllabus can be found here (slight changes are possible if new important topics come up).

Cost and Registration

I’m keeping the cost of these training classes relatively low. This is to make these classes accessible to more people, especially in these unusual and challenging times.

Cost: 800 USD if paid by an individual, 1500 USD if paid by a company. Multiple participants from the same company are entitled to a discount (email me for the details). Previous students of my classes are entitled to a 10% discount.

To register, send an email to zodiacon@live.com and specify “Windows Internals Training” in the title. The email should include your name, contact email, time zone, and company name (if any).

As usual, if you have any questions, feel free to send me an email, or DM me on twitter (@zodiacon) or Linkedin (https://www.linkedin.com/in/pavely/).

Dynamic Symbolic Links

While teaching a Windows Internals class recently, I came across a situation which looked like a bug to me, but turned out to be something I didn’t know about – dynamic symbolic links.

Symbolic links are Windows kernel objects that point to another object. The weird situation in question was when running WinObj from Sysinternals and navigating to the KenrelObjects object manager directory.

WinObj from Sysinternals

You’ll notice some symbolic link objects that look weird: MemoryErrors, PhysicalMemoryChange, HighMemoryCondition, LowMemoryCondition and a few others. The weird thing that is fairly obvious is that these symbolic link objects have empty targets. Double-clicking any one of them confirms no target, and also shows a curious zero handles, as well as quota change of zero:

Symbolic link properties

To add to the confusion, searching for any of them with Process Explorer yields something like this:

It seems these objects are events, and not symbolic links!

My first instinct was that there is a bug in WinObj (I rewrote it recently for Sysinternals, so was certain I introduced a bug). I ran an old WinObj version, but the result was the same. I tried other tools with similar functionality, and still got the same results. Maybe a bug in Process Explorer? Let’s see in the kernel debugger:

lkd> !object 0xFFFF988110EC0C20
Object: ffff988110ec0c20  Type: (ffff988110efb400) Event
    ObjectHeader: ffff988110ec0bf0 (new version)
    HandleCount: 4  PointerCount: 117418
    Directory Object: ffff828b10689530  Name: HighCommitCondition

Definitely an event and not a symbolic link. What’s going on? I debugged it in WinObj, and indeed the reported object type is a symbolic link. Maybe it’s a bug in the NtQueryDirectoryObject used to query a directory object for an object.

I asked Mark Russinovich, could there be a bug in Windows? Mark remembered that this is not a bug, but a feature of symbolic links, where objects can be created/resolved dynamically when accessing the symbolic link. Let’s see if we can see something in the debugger:

lkd> !object \kernelobjects\highmemorycondition
Object: ffff828b10659510  Type: (ffff988110e9ba60) SymbolicLink
    ObjectHeader: ffff828b106594e0 (new version)
    HandleCount: 0  PointerCount: 1
    Directory Object: ffff828b10656ce0  Name: HighMemoryCondition
    Flags: 0x000010 ( Local )
    Target String is '*** target string unavailable ***'

Clearly, there is target, but notice the flags value 0x10. This is the flag indicating the symbolic link is a dynamic one. To get further information, we need to look at the object with a “symbolic link lenses” by using the data structure the kernel uses to represent symbolic links:

lkd> dt nt!_OBJECT_SYMBOLIC_LINK ffff828b10659510

   +0x000 CreationTime     : _LARGE_INTEGER 0x01d73d87`21bd21e5
   +0x008 LinkTarget       : _UNICODE_STRING "--- memory read error at address 0x00000000`00000005 ---"
   +0x008 Callback         : 0xfffff802`08512250     long  nt!MiResolveMemoryEvent+0

   +0x010 CallbackContext  : 0x00000000`00000005 Void
   +0x018 DosDeviceDriveIndex : 0
   +0x01c Flags            : 0x10
   +0x020 AccessMask       : 0x24

The Callback member shows the function that is being called (MiResolveMemoryEvent) that “resolves” the symbolic link to the relevant event. There are currently 11 such events, their names visible with the following:

lkd> dx (nt!_UNICODE_STRING*)&nt!MiMemoryEventNames,11
(nt!_UNICODE_STRING*)&nt!MiMemoryEventNames,11                 : 0xfffff80207e02e90 [Type: _UNICODE_STRING *]
    [0]              : "\KernelObjects\LowPagedPoolCondition" [Type: _UNICODE_STRING]
    [1]              : "\KernelObjects\HighPagedPoolCondition" [Type: _UNICODE_STRING]
    [2]              : "\KernelObjects\LowNonPagedPoolCondition" [Type: _UNICODE_STRING]
    [3]              : "\KernelObjects\HighNonPagedPoolCondition" [Type: _UNICODE_STRING]
    [4]              : "\KernelObjects\LowMemoryCondition" [Type: _UNICODE_STRING]
    [5]              : "\KernelObjects\HighMemoryCondition" [Type: _UNICODE_STRING]
    [6]              : "\KernelObjects\LowCommitCondition" [Type: _UNICODE_STRING]
    [7]              : "\KernelObjects\HighCommitCondition" [Type: _UNICODE_STRING]
    [8]              : "\KernelObjects\MaximumCommitCondition" [Type: _UNICODE_STRING]
    [9]              : "\KernelObjects\MemoryErrors" [Type: _UNICODE_STRING]
    [10]             : "\KernelObjects\PhysicalMemoryChange" [Type: _UNICODE_STRING]

Creating dynamic symbolic links is only possible from kernel mode, of course, and is undocumented anyway.

At least the conundrum is solved.

Next Public Windows Internals training

I am announcing the next Windows Internals remote training to be held in July 2021 on the 12, 14, 15, 19, 21. Times: 11am to 7pm, London time.

The syllabus can be found here (slight changes are possible if new important topics come up).

Cost and Registration

I’m keeping the cost of these training classes relatively low. This is to make these classes accessible to more people, especially in these unusual and challenging times.

Cost: 800 USD if paid by an individual, 1500 USD if paid by a company. Multiple participants from the same company are entitled to a discount (email me for the details). Previous students of my classes are entitled to a 10% discount.

To register, send an email to zodiacon@live.com and specify “Windows Internals Training” in the title. The email should include your name, contact email, and company name (if any).

Later this year I plan a Windows Kernel Programming class. Stay tuned!

As usual, if you have any questions, feel free to send me an email, or DM me on twitter (@zodiacon) or Linkedin (https://www.linkedin.com/in/pavely/).

Upcoming Public Remote Training

I have recently completed another successful iteration of the Windows Internals training – thank you those who participated!

I am announcing two upcoming training classes, Windows Internals and Windows Kernel Programming.

Windows Internals (5 days)

I promised some folks that the next Internals training would be convenient to US-based time zones. That said, all time zones are welcome!

Dates: Sep 29, Oct 1, 5, 7, 8
Times: 8am to 4pm Pacific time (11am to 7pm Eastern)

The syllabus can be found here. I may make small changes in the final topics, but the major topics remain the same.

Windows Kernel Programming (4 days)

Dates: Oct 13, 15, 19, 21
Times: TBA

The syllabus can be found here. Again, slight changes are possible. This is a development-heavy course, so be prepared to write lots of code!

The selected time zone will be based on the majority of participants’ preference.

Cost and Registration

The cost for each class is kept relatively low (as opposed to other, perhaps similar offerings), as I’ve done in the past year or so. This is to make these classes accessible to more people, especially in these challenging times. If you register for both classes, you get 10% off the second class. Previous students of my classes get 10% off as well.

Cost: 750 USD if paid by an individual, 1500 USD if paid by a company. Multiple participants from the same company are entitled to a discount (email me for the details).

To register, send an email to zodiacon@live.com and specify “Training” in the title. The email should include your name, company name (if any) and preferred time zone.

Please read carefully the pre-requisites of each class, especially for Windows Kernel Programming. In case of doubt, talk to me.

If you have any questions, feel free to shoot me an email, or DM me on twitter (@zodiacon) or Linkedin (https://www.linkedin.com/in/pavely/).

For Companies

Companies that are interested in such (or other) training classes receive special prices. Topics can also be customized according to specific needs.

Other classes I provide include: Modern C++ Programming, Windows System Programming, COM Programming, C#/.NET Programming (Basic and Advanced), Advanced Windows Debugging, and more. Contact me for detailed syllabi if interested.

Next Windows Internals (Remote) Training

It’s been a while since I gave the Windows Internals training, so it’s time for another class of my favorite topics!

This time I decided to make it more afordable, to allow more people to participate. The cost is based on whether paid by an individual vs. a company. The training includes lab exercises – some involve working with tools, while others involve coding in C/C++.

  • Public 5-day remote class
  • Dates: April 20, 22, 23, 27, 30
  • Time: 8 hours / day. Exact hours TBD
  • Price: 750 USD (payed by individual) / 1500 USD (payed by company)
  • Register by emailing zodiacon@live.com and specifying “Windows Internals Training” in the title
    • Provide names of participants (discount available for multiple participants from the same company), company name (if any) and preferred time zone.
    • You’ll receive instructions for payment and other details
  • Virtual space is limited!

The training time zone will be finalized closer to the start date.

Objectives: Understand the Windows system architectureExplore the internal workings of process, threads, jobs, virtual memory, the I/O system and other mechanisms fundamental to the way Windows works

Write a simple software device driver to access/modify information not available from user mode

Target Audience: Experienced windows programmers in user mode or kernel mode, interested in writing better programs, by getting a deeper understanding of the internal mechanisms of the windows operating system.Security researchers interested in gaining a deeper understanding of Windows mechanisms (security or otherwise), allowing for more productive research
Pre-Requisites: Basic knowledge of OS concepts and architecture.Power user level working with Windows

Practical experience developing windows applications is an advantage

C/C++ knowledge is an advantage

  • Module 1: System Architecture
    • Brief Windows NT History
    • Windows Versions
    • Tools: Windows, Sysinternals, Debugging Tools for Windows
    • Processes and Threads
    • Virtual Memory
    • User mode vs. Kernel mode
    • Architecture Overview
    • Key Components
    • User/kernel transitions
    • APIs: Win32, Native, .NET, COM, WinRT
    • Objects and Handles
    • Sessions
    • Introduction to WinDbg
    • Lab: Task manager, Process Explorer, WinDbg
  • Module 2: Processes & Jobs
    • Process basics
    • Creating and terminating processes
    • Process Internals & Data Structures
    • The Loader
    • DLL explicit and implicit linking
    • Process and thread attributes
    • Protected processes and PPL
    • UWP Processes
    • Minimal and Pico processes
    • Jobs
    • Nested jobs
    • Introduction to Silos
    • Server Silos and Docker
    • Lab: viewing process and job information; creating processes; setting job limits
  • Module 3: Threads
    • Thread basics
    • Thread Internals & Data Structures
    • Creating and terminating threads
    • Thread Stacks
    • Thread Priorities
    • Thread Scheduling
    • CPU Sets
    • Direct Switch
    • Deep Freeze
    • Thread Synchronization
    • Lab: creating threads; thread synchronization; viewing thread information; CPU sets
  • Module 4: Kernel Mechanisms
    • Trap Dispatching
    • Interrupts
    • Interrupt Request Level (IRQL)
    • Deferred Procedure Calls (DPCs)
    • Exceptions
    • System Crash
    • Object Management
    • Objects and Handles
    • Sharing Objects
    • Thread Synchronization
    • Synchronization Primitives (Mutex, Semaphore, Events, and more)
    • Signaled vs. Non-Signaled
    • High IRQL Synchronization
    • Windows Global Flags
    • Kernel Event Tracing
    • Wow64
    • Lab: Viewing Handles, Interrupts; creating maximum handles; Thread synchronization
  • Module 5: Memory Management
    • Overview
    • Small, large and huge pages
    • Page states
    • Memory Counters
    • Address Space Layout
    • Address Translation Mechanisms
    • Heaps
    • APIs in User mode and Kernel mode
    • Page Faults
    • Page Files
    • Commit Size and Commit Limit
    • Workings Sets
    • Memory Mapped Files (Sections)
    • Page Frame Database
    • Other memory management features
    • Lab: committing & reserving memory; using shared memory; viewing memory related information
  • Module 6: Management Mechanisms
    • The Registry
    • Services
    • Starting and controlling services
    • Windows Management Instrumentation
    • Lab: Viewing and configuring services; Process Monitor

  • Module 7: I/O System
    • I/O System overview
    • Device Drivers
    • Plug & Play
    • The Windows Driver Model (WDM)
    • The Windows Driver Framework (WDF)
    • WDF: KMDF and UMDF
    • Device and Driver Objects
    • I/O Processing and Data Flow
    • IRPs
    • Power Management
    • Driver Verifier
    • Writing a Software Driver
    • Labs: viewing driver and device information; writing a software driver
  • Module 8: Security
    • Security Components
    • Virtualization Based Security
    • Hyper-V
    • Protecting objects
    • SIDs
    • User Access Control (UAC)
    • Tokens
    • Integrity Levels
    • ACLs
    • Privileges
    • Access checks
    • AppContainers
    • Logon
    • Control Flow Guard (CFG)
    • Process mitigations
    • Lab: viewing security information

Where did System Services 0 and 1 go?

System calls on Windows go through NTDLL.dll, where each system call is invoked by a syscall (x64) or sysenter (x86) CPU instruction, as can be seen from the following output of NtCreateFile from NTDLL:

0:000> u
ntdll!NtCreateFile:
00007ffc`c07fcb50 4c8bd1          mov     r10,rcx
00007ffc`c07fcb53 b855000000      mov     eax,55h
00007ffc`c07fcb58 f604250803fe7f01 test    byte ptr [SharedUserData+0x308 (00000000`7ffe0308)],1
00007ffc`c07fcb60 7503            jne     ntdll!NtCreateFile+0x15 (00007ffc`c07fcb65)
00007ffc`c07fcb62 0f05            syscall
00007ffc`c07fcb64 c3              ret
00007ffc`c07fcb65 cd2e            int     2Eh
00007ffc`c07fcb67 c3              ret

The important instructions are marked in bold. The value set to EAX is the system service number (0x55 in this case). The syscall instruction follows (the condition tested does not normally cause a branch). syscall causes transition to the kernel into the System Service Dispatcher routine, which is responsible for dispatching to the real system call implementation within the Executive. I will not go to the exact details here, but eventually, the EAX register must be used as a lookup index into the System Service Dispatch Table (SSDT), where each system service number (index) should point to the actual routine.

On x64 versions of Windows, the SSDT is available in the kernel debugger in the nt!KiServiceTable symbol:

lkd> dd nt!KiServiceTable
fffff804`13c3ec20  fced7204 fcf77b00 02b94a02 04747400
fffff804`13c3ec30  01cef300 fda01f00 01c06005 01c3b506
fffff804`13c3ec40  02218b05 0289df01 028bd600 01a98d00
fffff804`13c3ec50  01e31b00 01c2a200 028b7200 01cca500
fffff804`13c3ec60  02229b01 01bf9901 0296d100 01fea002

You might expect the values in the SSDT to be 64-bit pointers, pointing directly to the system services (this is the scheme used on x86 systems). On x64 the values are 32 bit, and are used as offsets from the start of the SSDT itself. However, the offset does not include the last hex digit (4 bits): this last value is the number of arguments to the system call.

Let’s see if this holds with NtCreateFile. Its service number is 0x55 as we’ve seen from user mode, so to get to the actual offset, we need to perform a simple calculation:

kd> dd nt!KiServiceTable+55*4 L1
fffff804`13c3ed74  020b9207

Now we need to take this offset (without the last hex digit), add it to the SSDT and this should point at NtCreateFile:

lkd> u nt!KiServiceTable+020b920
nt!NtCreateFile:
fffff804`13e4a540 4881ec88000000  sub     rsp,88h
fffff804`13e4a547 33c0            xor     eax,eax
fffff804`13e4a549 4889442478      mov     qword ptr [rsp+78h],rax
fffff804`13e4a54e c744247020000000 mov     dword ptr [rsp+70h],20h

Indeed – this is NtCreateFile. What about the argument count? The value stored is 7. Here is the prototype of NtCreateFile (documented in the WDK as ZwCreateFile):

NTSTATUS NtCreateFile(
  PHANDLE            FileHandle,
  ACCESS_MASK        DesiredAccess,
  POBJECT_ATTRIBUTES ObjectAttributes,
  PIO_STATUS_BLOCK   IoStatusBlock,
  PLARGE_INTEGER     AllocationSize,
  ULONG              FileAttributes,
  ULONG              ShareAccess,
  ULONG              CreateDisposition,
  ULONG              CreateOptions,
  PVOID              EaBuffer,
  ULONG              EaLength);

Clearly, there are 11 parameters, not just 7. Why the discrepency? The stored value is the number of parameters that are passed using the stack. In x64 calling convention, the first 4 arguments are passed using registers: RCX, RDX, R8, R9 (in this order).

Now back to the title of this post. Here are the first few entries in the SSDT again:

lkd> dd nt!KiServiceTable
fffff804`13c3ec20  fced7204 fcf77b00 02b94a02 04747400
fffff804`13c3ec30  01cef300 fda01f00 01c06005 01c3b506

The first two entries look different, with much larger numbers. Let’s try to apply the same logic for the first value (index 0):

kd> u nt!KiServiceTable+fced720
fffff804`2392c340 ??              ???
                    ^ Memory access error in 'u nt!KiServiceTable+fced720'

Clearly a bust. The value is in fact a negative value (in two’s complement), so we need to sign-extend it to 64 bit, and then perform the addition (leaving out the last hex digit as before):

kd> u nt!KiServiceTable+ffffffff`ffced720
nt!NtAccessCheck:
fffff804`1392c340 4c8bdc          mov     r11,rsp
fffff804`1392c343 4883ec68        sub     rsp,68h
fffff804`1392c347 488b8424a8000000 mov     rax,qword ptr [rsp+0A8h]

This is NtAccessCheck. The function’s implementation is in lower addresses than the SSDT itself. Let’s try the same exercise with index 1:

kd> u nt!KiServiceTable+ffffffff`ffcf77b0
nt!NtWorkerFactoryWorkerReady:
fffff804`139363d0 4c8bdc          mov     r11,rsp
fffff804`139363d3 49895b08        mov     qword ptr [r11+8],rbx

And we get system call number 1: NtWorkerFactoryWorkerReady.

For those fond of WinDbg scripting – write a script to display nicely all system call functions and their indices.