You may have been asked this question many times: “How much memory does this process consume?” The question seems innocent enough. Your first instinct might be to open Task Manager, go to the Processes tab, find the process in the list, and look at the column marked “Memory“. What could be simpler?
A complication is hinted at when looking in the Details tab. The default memory-related column is named “Memory (Active Private Working Set)”, which seems more complex than simply “Memory”. Opening the list of columns from the Details tab shows more columns where the term “Memory” is used. What gives?
The Processes’ tab Memory column is the same as the Details’ tab Memory (active private working set). But what does it mean? Let’s break it down:
Working set – the memory is accessible by the processor with no page fault exception. Simply put, the memory is in RAM (physical memory).
Private – the memory is private to the process. This is in contrast to shared memory, which is (at least can be) shared with other processes. The canonical example of shared memory is PE images – DLLs and executables. A DLL that is mapped to multiple processes will (in most cases) have a single presence in physical memory.
Active – this is an artificial term used by Task Manager related to UWP (Universal Windows Platform) processes. If a UWP process’ window is minimized, this column shows zero memory consumption, because in theory, since all the process’ threads are suspended, that memory can be repurposed for other processes to use. You can try it by running Calculator, and minimizing its window. You’ll see this column showing zero. Restore the window, and it will show some non-zero value. In fact, there is a column named Memory (private working set), which shows the same thing but does not take into consideration the “active” aspect of UWP processes.
So what does all this mean? The fact that this column shows only private memory is a good thing. That’s because the shared memory size (in most cases) is not controllable and is fixed – for example, the size of a DLL – it’s out of our control – the process just needs to use the DLL. The downside of this active private working set column is that fact it only shows memory current part of the process working set – in RAM. A process may allocate a large junk of memory, but most of it may not be in RAM right now, but it is still consumed, and counts towards the commit limit of the system.
Here is a simple example. I’m writing the following code to allocate (commit) 64 GM of memory:
Here is what Task manager shows in its Performance/Memory tab before the call:
“In Use” indicates current RAM (physical memory) usage – it’s 34.6 GB. The “Committed” part is more important – it indicates how much memory I can totally commit on the system, regardless of whether it’s in physical memory now or not. It shows “44/128 GB” – 44 GB are committed now (34.6 of that in RAM), and my commit limit is 128 GB (it’s the sum of my total RAM and the configured page files sizes). Here is the same view after I commit the above 64 GB:
Notice the physical memory didn’t change much, but the committed memory “jumped” by 64 GB, meaning there is now only 20 GB left for other processes to use before the system runs out of memory (or page file expansion occurs). Looking at the Details that for this Test process shows the active private working set column indicating a very low memory consumption because it’s looking at private RAM usage only:
Only when the process starts “touching” (using) the committed memory, physical pages will start being used by the process. The name “committed” indicates the commitment of the system to providing that entire memory block if required no matter what.
Where is that 64 GB shown? The column to use is called in Task Manager Commit Size, which is in fact private committed memory:
Commit Size is the correct column to look at when trying to ascertain memory consumption in processes. The sad thing is that it’s not the default column shown, and that’s why many people use the misleading active private working set column. My guess is the reason the misleading column is shown by default is because physical memory is easy to understand for most people, whereas virtual memory – (some of which is in RAM and some which is not) is not trivially understood.
Compare Commit Size to active private working set sometimes reveals a big difference – an indication that most of the private memory of a process is not in RAM right now, but the memory is still consumed as far as the memory manager is concerned.
A related confusion exists because of different terminology used by different tools. Specifically, Commit Size in Task Manager is called Private Bytes in Process Explorer and Performance Monitor.
Task Manager’s other memory columns allow you to look at more memory counters such as Working Set (total RAM used by a process, including private and shared memory), Peak Working Set, Memory (shared working set), and Working Set Delta.
There are other subtleties I am not expanding on in this post. Hopefully, I’ll touch on these in a future post.
Here is a simple experiment to try: open Visual Studio and create a C++ console application. All that app is doing is display “hello world” to the console:
#include <stdio.h>

int main() {
	printf("Hello, world!\n");
	return 0;
}
Build the executable in Release build and check its size. I get 11KB (x64). Not too bad, perhaps. However, if we check the dependencies of this executable (using the dumpbin command line tool or any PE Viewer), we’ll find the following in the Import directory:
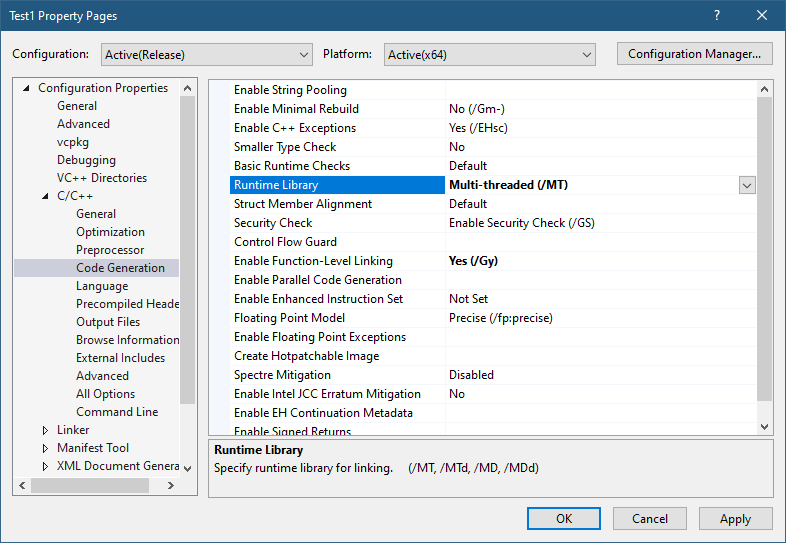
There are two dependencies: Kernel32.dll and VCRuntime140.dll. This means these DLLs will load at process start time no matter what. If any of these DLLs is not found, the process will crash. We can’t get rid of Kernel32 easily, but we may be able to link statically to the CRT. Here is the required change to VS project properties:
After building, the resulting executable jumps to 136KB in size! Remember, it’s a “hello, world” application. The Imports directory in a PE viewer now show Kernel32.dll as the only dependency.
Is that best we can do? Why do we need the CRT in the first place? One obvious reason is the usage of the printf function, which is implemented by the CRT. Maybe we can use something else without depending on the CRT. There are other reasons the CRT is needed. Here are a few:
The CRT is the one calling our main function with the correct argc and argv. This is expected behavior by developers.
Any C++ global objects that have constructors are executed by the CRT before the main function is invoked.
Other expected behaviors are provided by the CRT, such as correct handling of the errno (global) variable, which is not really global, but uses Thread-Local-Storage behind the scenes to make it per-thread.
The CRT implements the new and delete C++ operators, without which much of the C++ standard library wouldn’t work without major customization.
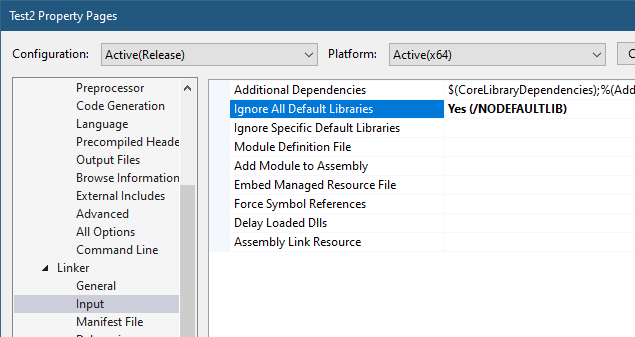
Still, we may be OK doing things outside the CRT, taking care of ourselves. Let’s see if we can pull it off. Let’s tell the linker that we’re not interested in the CRT:
Setting “Ignore All Default Libraries” tells the linker we’re not interested in linking with the CRT in any way. Building the app now gives some linker errors:
1>Test2.obj : error LNK2001: unresolved external symbol __security_check_cookie
1>Test2.obj : error LNK2001: unresolved external symbol __imp___acrt_iob_func
1>Test2.obj : error LNK2001: unresolved external symbol __imp___stdio_common_vfprintf
1>LINK : error LNK2001: unresolved external symbol mainCRTStartup
1>D:\Dev\Minimal\x64\Release\Test2.exe : fatal error LNK1120: 4 unresolved externals
One thing we expected is the missing printf implementation. What about the other errors? We have the missing “security cookie” implementation, which is a feature of the CRT to try to detect stack overrun by placing a “cookie” – some number – before making certain function calls and making sure that cookie is still there after returning. We’ll have to settle without this feature. The main missing piece is mainCRTStartup, which is the default entry point that the linker is expecting. We can change the name, or overwrite main to have that name.
First, let’s try to fix the linker errors before reimplementing the printf functionality. We’ll remove the printf call and rebuild. Things are improving:
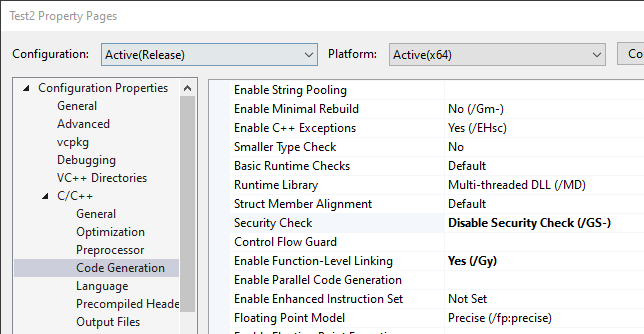
The “security cookie” feature can be removed with another compiler option:
When rebuilding, we get a warning about the “/sdl” (Security Developer Lifecycle) option conflicting with removing the security cookie, which we can remove as well. Regardless, the final linker error remains – mainCRTStartup.
We can rename main to mainCRTStartup and “implement” printf by going straight to the console API (part of Kernel32.Dll):
This compiles and links ok, and we get the expected output. The file size is only 4KB! An improvement even over the initial project. The dependencies are still just Kernel32.DLL, with the only two functions used:
You may be thinking that although we replaced printf, that’s wasn’t the full power of printf – it supports various format specifiers, etc., which are going to be difficult to reimplement. Is this just a futile exercise?
Not necessarily. Remember that every user mode process always links with NTDLL.dll, which means the API in NtDll is always available. As it turns out, a lot of functionality that is implemented by the CRT is also implemented in NTDLL. printf is not there, but the next best thing is – sprintf and the other similar formatting functions. They would fill a buffer with the result, and then we could call WriteConsole to spit it to the console. Problem solved!
Removing the CRT
Well, almost. Let’s add a definition for sprintf_s (we’ll be nice and go with the “safe” version), and then use it:
#include <Windows.h>

extern "C" int __cdecl sprintf_s(
	char* buffer,
	size_t sizeOfBuffer,
	const char* format,	...);

int mainCRTStartup() {
	char text[64];
	sprintf_s(text, _countof(text), "Hello, world from process %u\n", ::GetCurrentProcessId());
	::WriteConsoleA(::GetStdHandle(STD_OUTPUT_HANDLE),
		text, (DWORD)strlen(text), nullptr, nullptr);

	return 0;
}
Unfortunately, this does not link: sprintf_s is an unresolved external, just like strlen. It makes sense, since the linker does not know where to look for it. Let’s help out by adding the import library for NtDll:
#pragma comment(lib, "ntdll")
This should work, but one error persists – sprintf_s; strlen however, is resolved. The reason is that the import library for NtDll provided by Microsoft does not have an import entry for sprintf_s and other CRT-like functions. Why? No good reason I can think of. What can we do? One option is to create an NtDll.lib import library of our own and use it. In fact, some people have already done that. One such file can be found as part of my NativeAppsrepository (it’s called NtDll64.lib, as the name does not really matter). The other option is to link dynamically. Let’s do that:
int __cdecl sprintf_s_f(
	char* buffer, size_t sizeOfBuffer, const char* format, ...);

int mainCRTStartup() {
	auto sprintf_s = (decltype(sprintf_s_f)*)::GetProcAddress(
        ::GetModuleHandle(L"ntdll"), "sprintf_s");
	if (sprintf_s) {
		char text[64];
		sprintf_s(text, _countof(text), "Hello, world from process %u\n", ::GetCurrentProcessId());
		::WriteConsoleA(::GetStdHandle(STD_OUTPUT_HANDLE),
			text, (DWORD)strlen(text), nullptr, nullptr);
	}

	return 0;
}
Now it works and runs as expected.
You may be wondering why does NTDLL implement the CRT-like functions in the first place? The CRT exists, after all, and can be normally used. “Normally” is the operative word here. Native applications, those that can only depend on NTDLL cannot use the CRT. And this is why these functions are implemented as part of NTDLL – to make it easier to build native applications. Normally, native applications are built by Microsoft only. Examples include Smss.exe (the session manager), CSrss.exe (the Windows subsystem process), and UserInit.exe (normally executed by WinLogon.exe on a successful login).
One thing that may be missing in our “main” function are command line arguments. Can we just add the classic argc and argv and go about our business? Let’s try:
Seems simple enough. argv[0] should be the address of the executable path itself. The code carefully displays the address only, not trying to dereference it as a string. The result, however, is perplexing:
argc: -359940096 argv[0]: 0x74894808245C8948
This seems completely wrong. The reason we see these weird values (if you try it, you’ll get different values. In fact, you may get different values in every run!) is that the expected parameters by a true entry point of an executable is not based on argc and argv – this is part of the CRT magic. We don’t have a CRT anymore. There is in fact just one argument, and it’s the Process Environment Block (PEB). We can add some code to show some of what is in there (non-relevant code omitted):
<Winternl.h> contains some NTDLL definitions, such as a partially defined PEB. In it, there is a ProcessParameters member that holds the image path and the full command line. Here is the result on my console:
The PEB is the argument provided by the OS to the entry point, whatever its name is. This is exactly what native applications get as well. By the way, we could have used GetCommandLine from Kernel32.dll to get the command line if we didn’t add the PEB argument. But for native applications (that can only depend on NTDLL), GetCommandLine is not an option.
Going Native
How far are we from a true native application? What would be the motivation for such an application anyway, besides small file size and reduced dependencies? Let’s start with the first question.
To make our executable truly native, we have to do two things. The first is to change the subsystem of the executable (stored in the PE header) to Native. VS provides this option via a linker setting:
The second thing is to remove the dependency on Kernel32.Dll. No more WriteConsole and no GetCurrentProcessId. We will have to find some equivalent in NTDLL, or write our own implementation leveraging what NtDll has to offer. This is obviously not easy, given that most of NTDLL is undocumented, but most function prototypes are available as part of the Process Hacker/phnt project.
For the second question – why bother? Well, one reason is that native applications can be configured to run very early in Windows boot – these in fact run by Smss.exe itself when it’s the only existing user-mode process at that time. Such applications (like autochk.exe, a native chkdsk.exe) must be native – they cannot depend on the CRT or even on kernel32.dll, since the Windows Subsystem Process (csrss.exe) has not been launched yet.
Doing any kind of research into the Windows kernel requires working with a kernel debugger, mostly WinDbg (or WinDbg Preview). There are at least 3 “levels” of debugging the kernel.
Level 1: Local Kernel Debugging
The first is using a local kernel debugger, which means configuring WinDbg to look at the kernel of the local machine. This can be configured by running the following command in an elevated command window, and restarting the system:
bcdedit -debug on
You must disable Secure Boot (if enabled) for this command to work, as Secure Boot protects against putting the machine in local kernel debugging mode. Once the system is restarted, WinDbg launched elevated, select File/Kernel Debug and go with the “Local” option (WinDbg Preview shown):
If all goes well, you’ll see the “lkd>” prompt appearing, confirming you’re in local kernel debugging mode.
What can you in this mode? You can look at anything in kernel and user space, such as listing the currently existing processes (!process 0 0), or examining any memory location in kernel or user space. You can even change kernel memory if you so desire, but be careful, any “bad” change may crash your system.
The downside of local kernel debugging is that the system is a moving target, things change while you’re typing commands, so you don’t want to look at things that change quickly. Additionally, you cannot set any breakpoint; you cannot view any CPU registers, since these are changing constantly, and are on a CPU-basis anyway.
The upside of local kernel debugging is convenience – setting it up is very easy, and you can still get a lot of information with this mode.
Level 2: Remote Debugging of a Virtual Machine
The next level is a full kernel debugging experience of a virtual machine, which can be running locally on your host machine, or perhaps on another host somewhere. Setting this up is more involved. First, the target VM must be set up to allow kernel debugging and set the “interface” to the host debugger. Windows supports several interfaces, but for a VM the best to use is network (supported on Windows 8 and later).
First, go to the VM and ping the host to find out its IP address. Then type the following:
bcdedit /dbgsettings net hostip:172.17.32.1 port:55000 key:1.2.3.4
Replace the host IP with the correct address, and select an unused port on the host. The key can be left out, in which case the command will generate something for you. Since that key is needed on the host side, it’s easier to select something simple. If the target VM is not local, you might prefer to let the command generate a random key and use that.
Next, launch WinDbg elevated on the host, and attach to the kernel using the “Net” option, specifying the correct port and key:
Restart the target, and it should connect early in its boot process:
Microsoft (R) Windows Debugger Version 10.0.25200.1003 AMD64
Copyright (c) Microsoft Corporation. All rights reserved.

Using NET for debugging
Opened WinSock 2.0
Waiting to reconnect...
Connected to target 172.29.184.23 on port 55000 on local IP 172.29.176.1.
You can get the target MAC address by running .kdtargetmac command.
Connected to Windows 10 25309 x64 target at (Tue Mar  7 11:38:18.626 2023 (UTC - 5:00)), ptr64 TRUE
Kernel Debugger connection established.  (Initial Breakpoint requested)

************* Path validation summary **************
Response                         Time (ms)     Location
Deferred                                       SRV*d:\Symbols*https://msdl.microsoft.com/download/symbols
Symbol search path is: SRV*d:\Symbols*https://msdl.microsoft.com/download/symbols
Executable search path is:
Windows 10 Kernel Version 25309 MP (1 procs) Free x64
Edition build lab: 25309.1000.amd64fre.rs_prerelease.230224-1334
Machine Name:
Kernel base = 0xfffff801`38600000 PsLoadedModuleList = 0xfffff801`39413d70
System Uptime: 0 days 0:00:00.382
nt!DebugService2+0x5:
fffff801`38a18655 cc              int     3
Enter the g command to let the system continue. The prompt is “kd>” with the current CPU number on the left. You can break at any point into the target by clicking the “Break” toolbar button in the debugger. Then you can set up breakpoints, for whatever you’re researching. For example:
In this “level” of debugging you have full control of the system. When in a breakpoint, nothing is moving. You can view register values, call stacks, etc., without anything changing “under your feet”. This seems perfect, so do we really need another level?
Some aspects of a typical kernel might not show up when debugging a VM. For example, looking at the list of interrupt service routines (ISRs) with the !idt command on my Hyper-V VM shows something like the following (truncated):
Some things are missing, such as the keyboard interrupt handler. This is due to certain things handled “internally” as the VM is “enlightened”, meaning it “knows” it’s a VM. Normally, it’s a good thing – you get nice support for copy/paste between the VM and the host, seamless mouse and keyboard interaction, etc. But it does mean it’s not the same as another physical machine.
Level 3: Remote debugging of a physical machine
In this final level, you’re debugging a physical machine, which provides the most “authentic” experience. Setting this up is the trickiest. Full description of how to set it up is described in the debugger documentation. In general, it’s similar to the previous case, but network debugging might not work for you depending on the network card type your target and host machines have.
If network debugging is not supported because of the limited list of network cards supported, your best bet is USB debugging using a dedicated USB cable that you must purchase. The instructions to set up USB debugging are provided in the docs, but it may require some trial and error to locate the USB ports that support debugging (not all do). Once you have that set up, you’ll use the “USB” tab in the kernel attachment dialog on the host. Once connected, you can set breakpoints in ISRs that may not exist on a VM:
Today I’m happy to announce two training classes to take place in April and May. These classes will be in 4-hour session chunks, so that it’s easier to consume even for uncomfortable time zones.
The first is Advanced Windows Kernel Programming, a class I was promising for quite some time now… it will be held on the following dates:
April: 18, 20, 24, 27 and May: 1, 4, 8, 11 (4 days total)
Times: 11am to 3pm ET (8am-12pm PT, 4pm to 8pm UT/GMT)
The course will include advanced topics in Windows kernel development, and is recommended for those that were in my Windows Kernel Programming class or have equivalent knowledge; for example, by reading my book Windows Kernel Programming.
Example topics include: deep dive into Windows’ kernel design, working with APCs, Windows Filtering Platform callout drivers, advanced memory management techniques, plug & play filter drivers, and more!
The second class is Windows Internals to be held on the following dates:
Times: 11am to 3pm ET (8am-12pm PT, 4pm to 8pm UT/GMT)
The syllabus can be found here (some modifications possible, but the general outline remains).
Cost 950 USD (if paid by an individual), 1900 USD (if paid by a company). The cost is the same for these training classes. Previous students in my classes get 10% off. Multiple participants from the same company get a discount as well (contact me for the details).
If you’d like to register, please send me an email to zodiacon@live.com with the name of the training in the email title, provide your full name, company (if any), preferred contact email, and your time zone.
The sessions will be recorded, so you can watch any part you may be missing, or that may be somewhat overwhelming in “real time”.
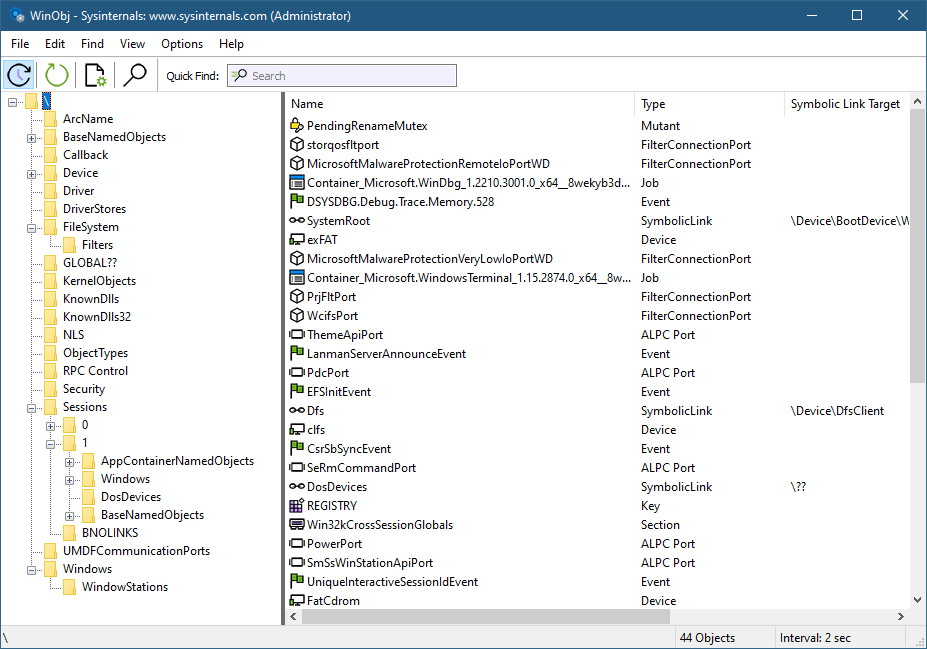
A lot of the functionality in Windows is based around various kernel objects. One such object is a Directory, not to be confused with a directory in a file system. A Directory object is conceptually simple: it’s a container for other kernel objects, including other Directory objects, thus creating a hierarchy used by the kernel’s Object Manager to manage named objects. This arrangement can be easily seen with tools like WinObj from Sysinternals:
The left part of WinObj shows object manager directories, where named objects are “stored” and can be located by name. Clear and simple enough.
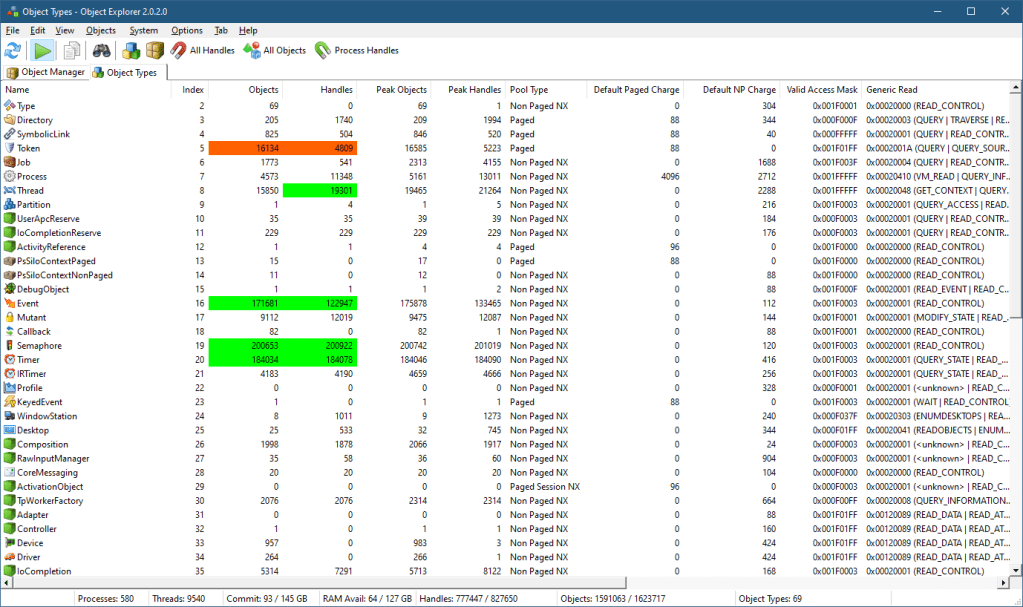
However, Directory objects can be unnamed as well as named. How can this be? Here is my Object Explorer tool (similar functionality is available with my System Explorer tool as well). One of its views is a “statistical” view of all object types, some of their properties, such as their name, type index, number of objects and handles, peak number of objects and handles, generic access mapping, and the pool type they’re allocated from.
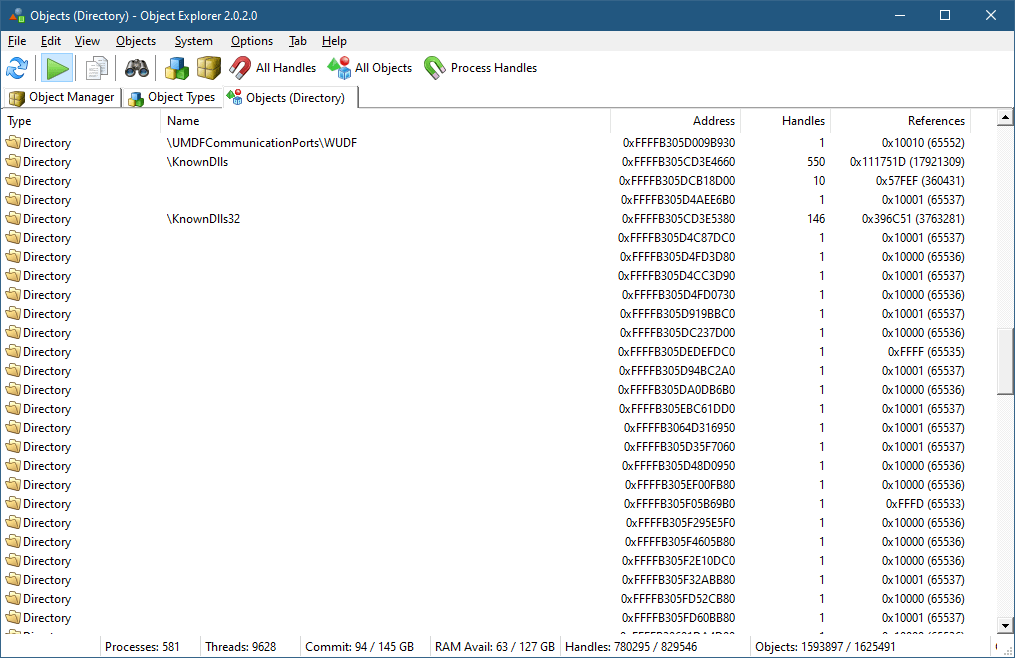
If you right-click the Directory object type and select “All Objects”, you’ll see another view that shows all Directory objects in the system (well, not necessarily all, but most*).
If you scroll a bit, you’ll see many unnamed Directory objects that have no name:
It seems weird, as a Directory with no name doesn’t make sense. These directories, however, are “real” and serve an important purpose – managing a private object namespace. I blogged about private object namespaces quite a few years ago (it was in my old blog site that is now unfortunately lost), but here is the gist of it:
Object names are useful because they allow easy sharing between processes. For example, if two or more processes would like to share memory, they can create a memory mapped file object (called Section within the kernel) with a name they are all aware of. Calling CreateFileMapping (or one of its variants) with the same name will create the object (by the first caller), where subsequent callers get handles to the existing object because it was looked up by name.
This is easy and useful, but there is a possible catch: since the name is “visible” using tools or APIs, other processes can “interfere” with the object by getting their own handle using that visible name and “meddle” with the object, maliciously or accidentally.
The solution to this problem arrived in Windows Vista with the idea of private object namespaces. A set of cooperating processes can create a private namespace only they can use, protected by a “secret” name and more importantly a boundary descriptor. The details are beyond the scope of this post, but it’s all documented in the Windows API functions such as CreateBoundaryDescriptor, CreatePrivateNamespace and friends. Here is an example of using these APIs to create a private namespace with a section object in it (error handling omitted):
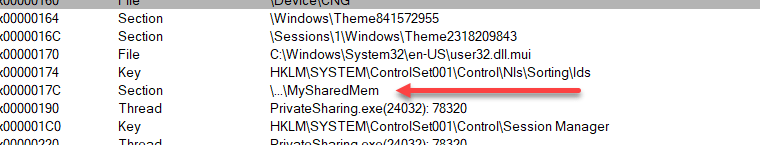
If you run this demo application, and look at the resulting handle (hSharedMem) in the above code in a tool like Process Explorer or Object Explorer you’ll see the name of the object is not given:
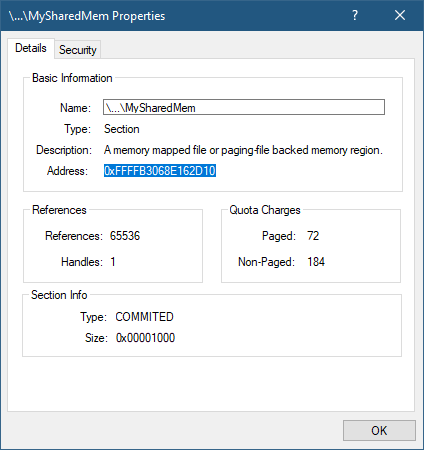
The full name is not shown and cannot be retrieved from user mode. And even if it could somehow be located, the boundary descriptor provides further protection. Let’s examine this object in the kernel debugger. Copying its address from the object’s properties:
Pasting the address into a local kernel debugger – first using the generic !object command:
The name is there, but the directory object is there as well. Let’s examine it:
lkd> !object ffffb3069e8cbe00
Object: ffffb3069e8cbe00  Type: (ffff9507ed6d0d20) Directory
    ObjectHeader: ffffb3069e8cbdd0 (new version)
    HandleCount: 3  PointerCount: 98300

    Hash Address          Type                      Name
    ---- -------          ----                      ----
     19  ffffb3068e162d10 Section                   MySharedMem
There is one object in this directory. What’s the directory’s name? We need to examine the object header for that – its address is given in the above output:
Getting a kernel’s object name is a little tricky, and will not be fully described here. The first requirement is the InfoMask member must have bit 1 set (value of 2), as this indicates a name is present. Since it’s not (the value is 8), there is no name to this directory. We can examine the directory object in more detail by looking at the real data structure underneath given the object’s original address:
The interesting piece is the NamespaceEntry member, which is not-NULL. This indicates the purpose of this directory: to be a container for a private namespace’s objects. You can also click on HasBuckets and locate the single section object there.
Going back to Process Explorer, enabling unnamed object handles (View menu, Show Unnamed Handles and Mappings) and looking for unnamed directory objects:
The directory’s address is the same one we were looking at!
The pointer at NamespaceEntry points to an undocumented structure that is not currently provided with the symbols. But just looking a bit beyond the directory’s object structure shows a hint:
The name “MyDescriptor” is clearly visible, which is the name of the boundary descriptor in the above code.
The kernel debugger’s documentation indicates that the !object command with a -p switch should show the private namespaces. However, this fails:
lkd> !object -p
00000000: Unable to get value of ObpPrivateNamespaceLookupTable
The debugger seems to fail locating a global kernel variable. This is probably a bug in the debugger command, because object namespaces scope has changed since the introduction of Server Silos in Windows 10 version 1607 (for example, Docker uses these when running Windows containers). Each silo has its own object manager namespace, so the old global variable does not exist anymore. I suspect Microsoft has not updated this command switch to support silos. Even with no server silos running, the host is considered to be in its own (global) silo, called host silo. You can see its details by utilizing the !silo debugger command:
kd> !silo -g host
Server silo globals fffff80766124540:
		Default Error Port: ffff950815bee140
		ServiceSessionId  : 0
		OB Root Directory :
		State             : Running
Clicking the “Server silo globals” link, shows more details:
PrivateNamespaceLookupTable is the root object for the private namespaces for this Silo (in this example it’s the host silo).
The interested reader is welcome to dig into this further.
The list of private namespaces is provided with the WinObjEx64 tool if you run it elevated and have local kernel debugging enabled, as it uses the kernel debugger’s driver to read kernel memory.
* Most objects, because the way Object Explorer works is by enumerating handles and associating them with objects. However, some objects are held using references from the kernel with zero handles. Such objects cannot be detected by Object Explorer.
I’m happy to open registration for the next 5 dayWindowsInternals training to be conducted in November in the following dates and from 11am to 7pm, Eastern Standard Time (EST) (8am to 4pm PST): 21, 22, 28, 29, 30.
The syllabus can be found here (some modifications possible, but the general outline should remain).
Training cost is 900 USD if paid by an individual, or 1800 USD if paid by a company. Participants in any of my previous training classes get 10% off.
If you’d like to register, please send me an email to zodiacon@live.com with “Windows Internals training” in the title, provide your full name, company (if any), preferred contact email, and your time zone.
The sessions will be recorded, so you can watch any part you may be missing, or that may be somewhat overwhelming in “real time”.
The term “Zombie Process” in Windows is not an official one, as far as I know. Regardless, I’ll define zombie process to be a process that has exited (for whatever reason), but at least one reference remains to the kernel process object (EPROCESS), so that the process object cannot be destroyed.
How can we recognize zombie processes? Is this even important? Let’s find out.
All kernel objects are reference counted. The reference count includes the handle count (the number of open handles to the object), and a “pointer count”, the number of kernel clients to the object that have incremented its reference count explicitly so the object is not destroyed prematurely if all handles to it are closed.
Process objects are managed within the kernel by the EPROCESS (undocumented) structure, that contains or points to everything about the process – its handle table, image name, access token, job (if any), threads, address space, etc. When a process is done executing, some aspects of the process get destroyed immediately. For example, all handles in its handle table are closed; its address space is destroyed. General properties of the process remain, however, some of which only have true meaning once a process dies, such as its exit code.
Process enumeration tools such as Task Manager or Process Explorer don’t show zombie processes, simply because the process enumeration APIs (EnumProcesses, Process32First/Process32Next, the native NtQuerySystemInformation, and WTSEnumerateProcesses) don’t return these – they only return processes that can still run code. The kernel debugger, on the other hand, shows all processes, zombie or not when you type something like !process 0 0. Identifying zombie processes is easy – their handle table and handle count is shown as zero. Here is one example:
Any kernel object referenced by the process object remains alive as well – such as a job (if the process is part of a job), and the process primary token (access token object). We can get more details about the process by passing the detail level “1” in the !process command:
Notice the address space does not exist anymore (VadRoot is zero). The VAD (Virtual Address Descriptors) is a data structure managed as a balanced binary search tree that describes the address space of a process – which parts are committed, which parts are reserved, etc. No address space exists anymore. Other details of the process are still there as they are direct members of the EPROCESS structure, such as the kernel and user time the process has used, its start and exit times (not shown in the debugger’s output above).
We can ask the debugger to show the reference count of any kernel object by using the generic !object command, to be followed by !trueref if there are handles open to the object:
Clearly, there is a single handle open to the process and that’s the only thing keeping it alive.
One other thing that remains is the unique process ID (shown as Cid in the above output). Process and thread IDs are generated by using a private handle table just for this purpose. This explains why process and thread IDs are always multiples of four, just like handles. In fact, the kernel treats PIDs and TIDs with the HANDLE type, rather with something like ULONG. Since there is a limit to the number of handles in a process (16711680, the reason is not described here), that’s also the limit for the number of process and threads that could exist on a system. This is a rather large number, so probably not an issue from a practical perspective, but zombie processes still keep their PIDs “taken”, so it cannot be reused. This means that in theory, some code can create millions of processes, terminate them all, but not close the handles it receives back, and eventually new processes could not be created anymore because PIDs (and TIDs) run out. I don’t know what would happen then 🙂
Here is a simple loop to do something like that by creating and destroying Notepad processes but keeping handles open:
WCHAR name[] = L"notepad";
STARTUPINFO si{ sizeof(si) };
PROCESS_INFORMATION pi;
int i = 0;
for (; i < 1000000; i++) {	// use 1 million as an example
	auto created = ::CreateProcess(nullptr, name, nullptr, nullptr,
        FALSE, 0, nullptr, nullptr, &si, &pi);
	if (!created)
		break;
	::TerminateProcess(pi.hProcess, 100);
	printf("Index: %6d PID: %u\n", i + 1, pi.dwProcessId);
	::CloseHandle(pi.hThread);
}
printf("Total: %d\n", i);
The code closes the handle to the first thread in the process, as keeping it alive would create “Zombie Threads”, much like zombie processes – threads that can no longer run any code, but still exist because at least one handle is keeping them alive.
How can we get a list of zombie processes on a system given that the “normal” tools for process enumeration don’t show them? One way of doing this is to enumerate all the process handles in the system, and check if the process pointed by that handle is truly alive by calling WaitForSingleObjecton the handle (of course the handle must first be duplicated into our process so it’s valid to use) with a timeout of zero – we don’t want to wait really. If the result is WAIT_OBJECT_0, this means the process object is signaled, meaning it exited – it’s no longer capable of running any code. I have incorporated that into my Object Explorer (ObjExp.exe) tool. Here is the basic code to get details for zombie processes (the code for enumerating handles is not shown but is available in the source code):
m_Items.clear();
m_Items.reserve(128);
std::unordered_map<DWORD, size_t> processes;
for (auto const& h : ObjectManager::EnumHandles2(L"Process")) {
	auto hDup = ObjectManager::DupHandle(
        (HANDLE)(ULONG_PTR)h->HandleValue , h->ProcessId,
        SYNCHRONIZE | PROCESS_QUERY_LIMITED_INFORMATION);
	if (hDup && WAIT_OBJECT_0 == ::WaitForSingleObject(hDup, 0)) {
		//
		// zombie process
		//
		auto pid = ::GetProcessId(hDup);
		if (pid) {
			auto it = processes.find(pid);
			ZombieProcess zp;
			auto& z = it == processes.end() ? zp : m_Items[it->second];
			z.Pid = pid;
			z.Handles.push_back({ h->HandleValue, h->ProcessId });
			WCHAR name[MAX_PATH];
			if (::GetProcessImageFileName(hDup,
                name, _countof(name))) {
				z.FullPath =
                    ProcessHelper::GetDosNameFromNtName(name);
				z.Name = wcsrchr(name, L'\\') + 1;
			}
			::GetProcessTimes(hDup,
                (PFILETIME)&z.CreateTime, (PFILETIME)&z.ExitTime,
                (PFILETIME)&z.KernelTime, (PFILETIME)&z.UserTime);
			::GetExitCodeProcess(hDup, &z.ExitCode);
			if (it == processes.end()) {
				m_Items.push_back(std::move(z));
				processes.insert({ pid, m_Items.size() - 1 });
			}
		}
	}
	if (hDup)
		::CloseHandle(hDup);
}
The data structure built for each process and stored in the m_Items vector is the following:
The ObjectManager::DupHandle function is not shown, but it basically calls DuplicateHandle for the process handle identified in some process. if that works, and the returned PID is non-zero, we can go do the work. Getting the process image name is done with GetProcessImageFileName– seems simple enough, but this function gets the NT name format of the executable (something like \Device\harddiskVolume3\Windows\System32\Notepad.exe), which is good enough if only the “short” final image name component is desired. if the full image path is needed in Win32 format (e.g. “c:\Windows\System32\notepad.exe”), it must be converted (ProcessHelper::GetDosNameFromNtName). You might be thinking that it would be far simpler to call QueryFullProcessImageName and get the Win32 name directly – but this does not work, and the function fails. Internally, the NtQueryInformationProcess native API is called with ProcessImageFileNameWin32 in the latter case, which fails if the process is a zombie one.
Running Object Explorer and selecting Zombie Processes from the System menu shows a list of all zombie processes (you should run it elevated for best results):
Object Explorer showing zombie processes
The above screenshot shows that many of the zombie processes are kept alive by GameManagerService.exe. This executable is from Razer running on my system. It definitely has a bug that keeps process handle alive way longer than needed. I’m not sure it would ever close these handles. Terminating this process will resolve the issue as the kernel closes all handles in a process handle table once the process terminates. This will allow all those processes that are held by that single handle to be freed from memory.
I plan to add Zombie Threads to Object Explorer – I wonder how many threads are being kept “alive” without good reason.
The Windows Registry is one of the most recognized aspects of Windows. It’s a hierarchical database, storing information on a machine-wide basis and on a per-user basis… mostly. In this post, I’d like to examine the major parts of the Registry, including the “real” Registry.
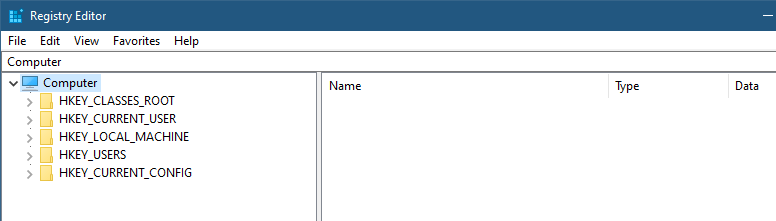
Looking at the Registry is typically done by launching the built-in RegEdit.exe tool, which shows the five “hives” that seem to comprise the Registry:
RegEdit showing the main hives
These so-called “hives” provide some abstracted view of the information in the Registry. I’m saying “abstracted”, because not all of these are true hives. A true hive is stored in a file. The full hive list can be found in the Registry itself – at HKLM\SYSTEM\CurrentControlSet\Control\hivelist (I’ll abbreviate HKEY_LOCAL_MACHINE as HKLM), mapping an internal key name to the file where it’s stored (more on these “internal” key names will be discussed soon):
The hive list
Let’s examine the so-called “hives” as seen in the root RegEdit’s view.
HKEY_LOCAL_MACHINE is the simplest to understand. It contains machine-wide information, most of it stored in files (persistent). Some details related to hardware is built when the system initializes and is only kept in memory while the system is running. Such keys are volatile, since their contents disappear when the system is shut down. There are many interesting keys within HKLM, but my goal is not to go over every key (that would take a full book), but highlight a few useful pieces. HKLM\System\CurrentControlSet\Services is the key where all services and device drivers are installed. Note that “CurrentControlSet” is not a true key, but in fact is a link key, connecting it to something like HKLM\System\ControlSet001. The reason for this indirection is beyond the scope of this post. Regedit does not show this fact directly – there is no way to tell whether a key is a true key or just points to a different key. This is one reason I createdTotal Registry (formerly called Registry Explorer), that shows these kind of nuances:
The liked key seems to have a weird name starting with \REGISTRY\MACHINE\. We’ll get to that shortly.
Other subkeys of note under HKLM include SOFTWARE, where installed applications store their system-level information; SAM and SECURITY, where local security policy and local accounts information are managed. These two subkeys contents is not not visible – even administrators don’t get access – only the SYSTEM account is granted access. One way to see what’s in these keys is to use psexec from Sysinternals to launch RegEdit or TotalRegistry under the SYSTEM account. Here is a command you can run in an elevated command window that will launch RegEdit under the SYSTEM account (if you’re using RegEdit, close it first):
psexec -s -i -d RegEdit
The -s switch indicates the SYSTEM account. -i is critical as to run the process in the interactive session (the default would run it in session 0, where no interactive user will ever see it). The -d switch is optional, and simply returns control to the console while the process is running, rather than waiting for the process to terminate.
The other way to gain access to the SAM and SECURITY subkeys is to use the “Take Ownership” privilege (easy to do when the Permissions dialog is open), and transfer the ownership to an admin user – the owner can specify who can do what with an object, and allow itself full access. Obviously, this is not a good idea in general, as it weakens security.
The BCD00000000 subkey contains the Boot Configuration Data (BCD), normally accessed using the bcdedit.exe tool.
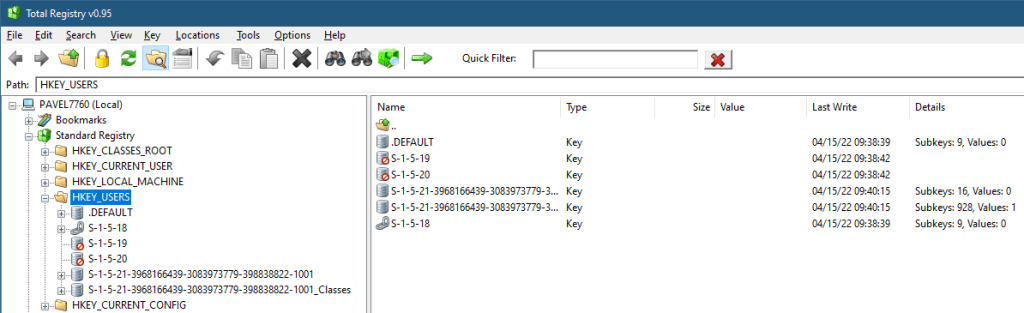
HKEY_USERS – this is the other hive that truly stores data. Its subkeys contain user profiles for all users that ever logged in locally to this machine. Each subkey’s name is a Security ID (SID), in its string representation:
HKEY_USERS
There are 3 well-known SIDs, representing the SYSTEM (S-1-5-18), LocalService (S-1-5-19), and NetworkService (S-1-5-20) accounts. These are the typical accounts used for running Windows Services. “Normal” users get ugly SIDs, such as the one shown – that’s my user’s local SID. You may be wondering what is that “_Classes” suffix in the second key. We’ll get to that as well.
HKEY_CURRENT_USER is a link key, pointing to the user’s subkey under HKEY_USERS running the current process. Obviously, the meaning of “current user” changes based on the process access token looking at the Registry.
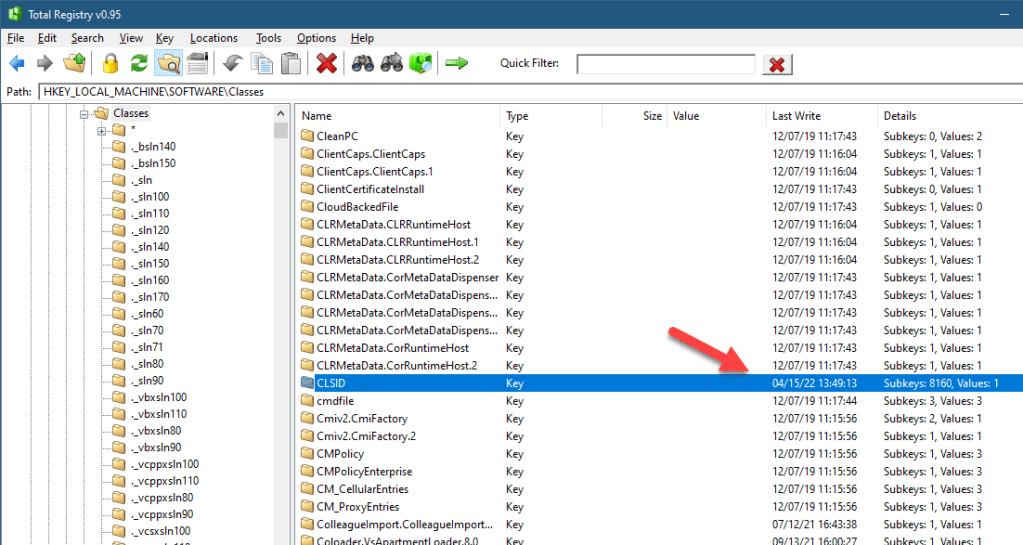
HKEY_CLASSES_ROOT is the most curious of the keys. It’s not a “real” key in the sense that it’s not a hive – not stored in a file. It’s not a link key, either. This key is a “combination” of two keys: HKLM\Software\Classes and HKCU\Software\Classes. In other words, the information in HKEY_CLASSES_ROOT is coming from the machine hive first, but can be overridden by the current user’s hive. What information is there anyway? The first thing is shell-related information, such as file extensions and associations, and all other information normally used by Explorer.exe. The second thing is information related to the Component Object Model (COM). For example, the CLSID subkey holds COM class registration (GUIDs you can pass to CoCreateInstance to (potentially) create a COM object of that class). Looking at the CLSID subkey under HKLM\Software\Classes shows there are 8160 subkeys, or roughly 8160 COM classes registered on my system from HKLM:
HKLM\Software\Classes
Looking at the same key under HKEY_CURRENT_USER tells a different story:
HKCU\Software\Classes
Only 46 COM classes provide extra or overridden registrations. HKEY_CLASSES_ROOT combines both, and uses HKCU in case of a conflict (same key name). This explains the extra “_Classes” subkey within the HKEY_USERS key – it stores the per user stuff (in the file UsrClasses.dat in something like c:\Users\<username>\AppData\Local\Microsoft\Windows).
HKEY_CURRENT_CONFIG is a link to HKLM\SYSTEM\CurrentControlSet\Hardware\Profiles\Current
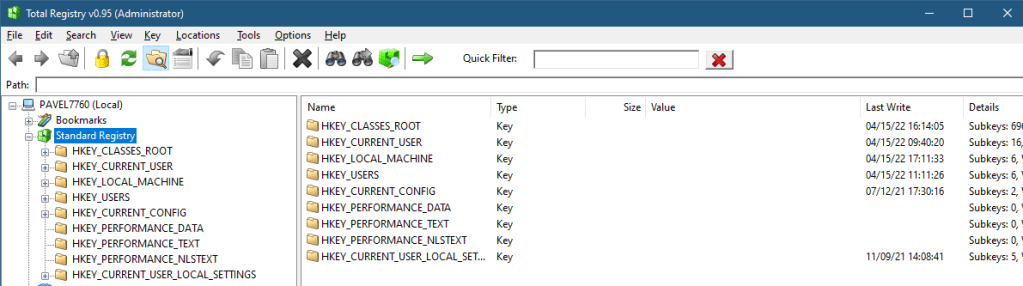
The list of “standard” hives (the hives accessible by official Windows APIs such as RegOpenKeyEx contains some more that are not shown by Regedit. They can be viewed by TotalReg if the option “Extra Hives” is selected in the View menu. At this time, however, the tool needs to be restarted for this change to take effect (I just didn’t get around to implementing the change dynamically, as it was low on my priority list). Here are all the hives accessible with the official Windows API:
All hives
I’ll let the interested reader to dig further into these “extra” hives. On of these hives deserves special mentioning – HKEY_PERFORMANCE_DATA – it was used in the pre Windows 2000 days as a way to access Performance Counters. Registry APIs had to be used at the time. Fortunately, starting from Windows 2000, a new dedicated API is provided to access Performance Counters (functions starting with Pdh* in <pdh.h>).
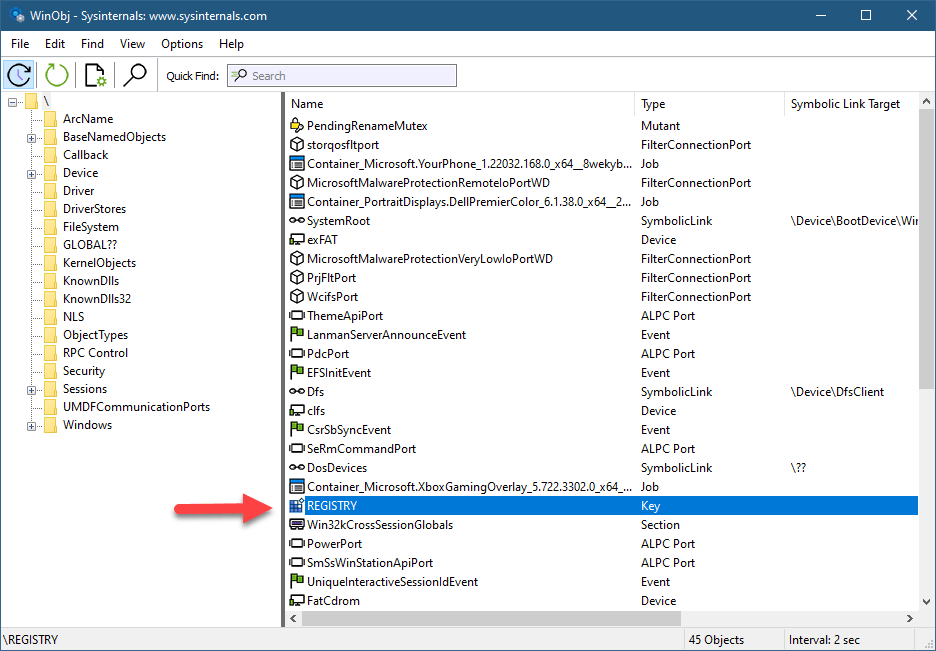
Is this it? Is this the entire Registry? Not quite. As you can see in TotalReg, there is a node called “Registry”, that tells yet another story. Internally, all Registry keys are rooted in a single key called REGISTRY. This is the only named Registry key. You can see it in the root of the Object Manager’s namespace with WinObjfrom Sysinternals:
WinObj from Sysinternals showing the Registry key object
Here is the object details in a Local Kernel debugger:
All other Registry keys are based off of that root key, the Configuration Manager (the kernel component in charge of the Registry) parses the remaining path as expected. This is the real Registry. The official Windows APIs cannot use this path format, but native APIs can. For example, using NtOpenKey (documented as ZwOpenKey in the Windows Driver Kit, as this is a system call) allows such access. This is how TotalReg is able to look at the real Registry.
Clearly, the normal user-mode APIs somehow map the “standard” hive path to the real Registry path. The simplest is the mapping of HKEY_LOCAL_MACHINE to \REGISTRY\MACHINE. Another simple one is HKEY_USERS mapped to \REGISTRY\USER. HKEY_CURRENT_USER is a bit more complex, and needs to be mapped to the per-user hive under \REGISTRY\USER. The most complex is our friend HKEY_CLASSES_ROOT – there is no simple mapping – the APIs have to check if there is per-user override or not, etc.
Lastly, it seems there are keys in the real Registry that cannot be reached from the standard Registry at all:
The real Registry
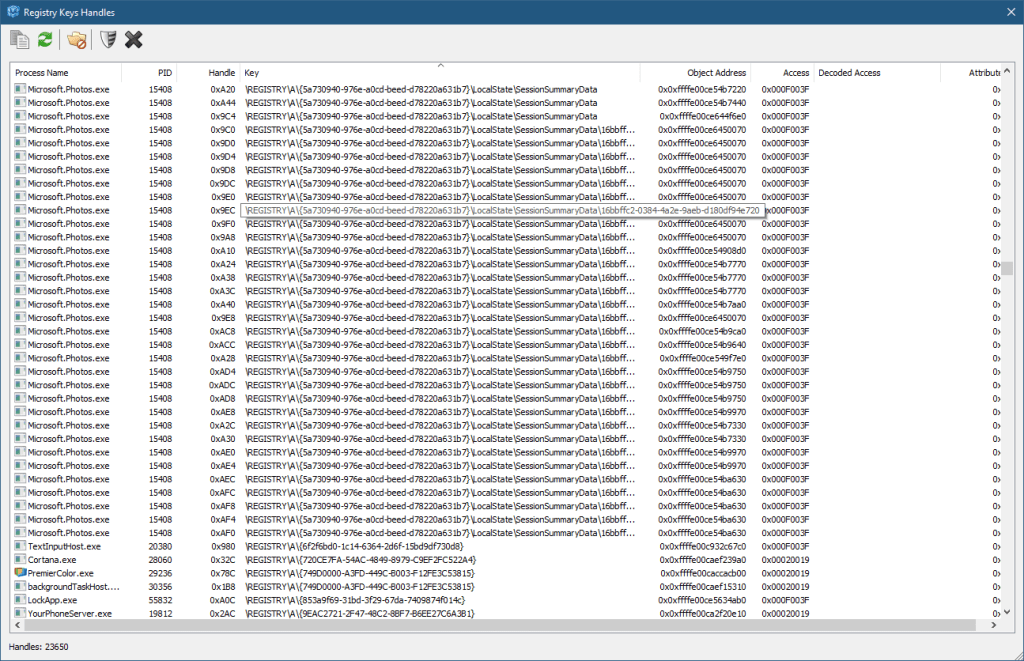
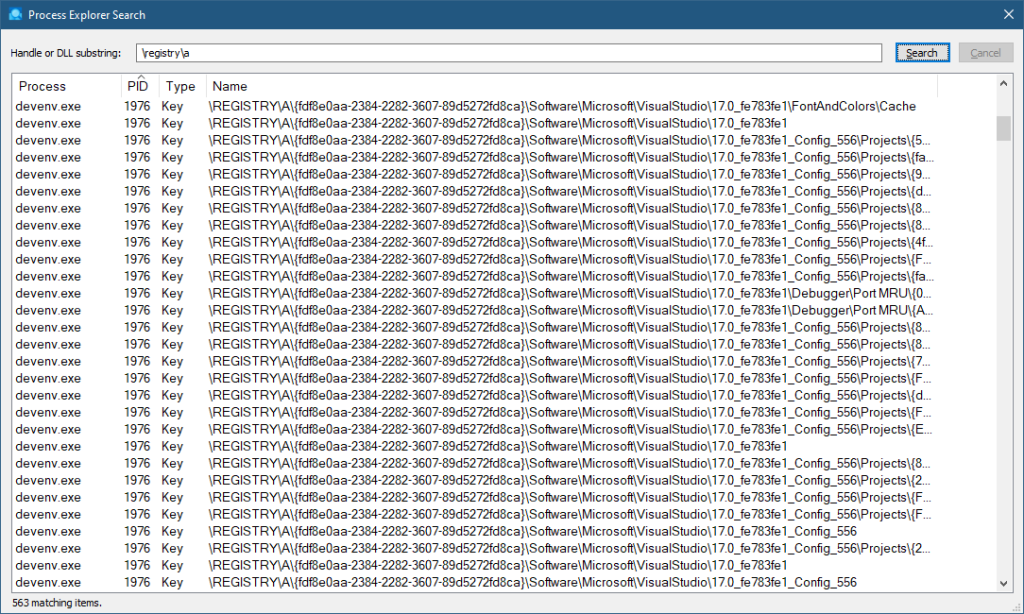
There is a key named “A” which seems inaccessible. This key is used for private keys in processes, very common in Universal Windows Application (UWP) processes, but can be used in other processes as well. They are not accessible generally, not even with kernel code – the Configuration Manager prevents it. You can verify their existence by searching for \Registry\A in tools like Process Explorer or TotalReg itself (by choosing Scan Key Handles from the Tools menu). Here is TotalReg, followed by Process Explorer:
TotalReg key handlesProcess Explorer key handles
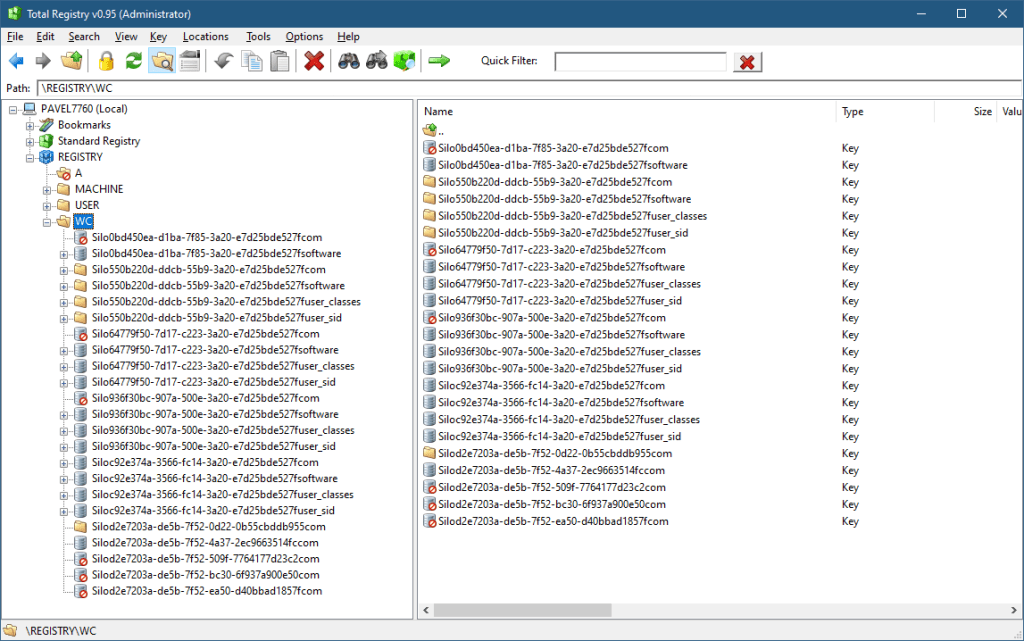
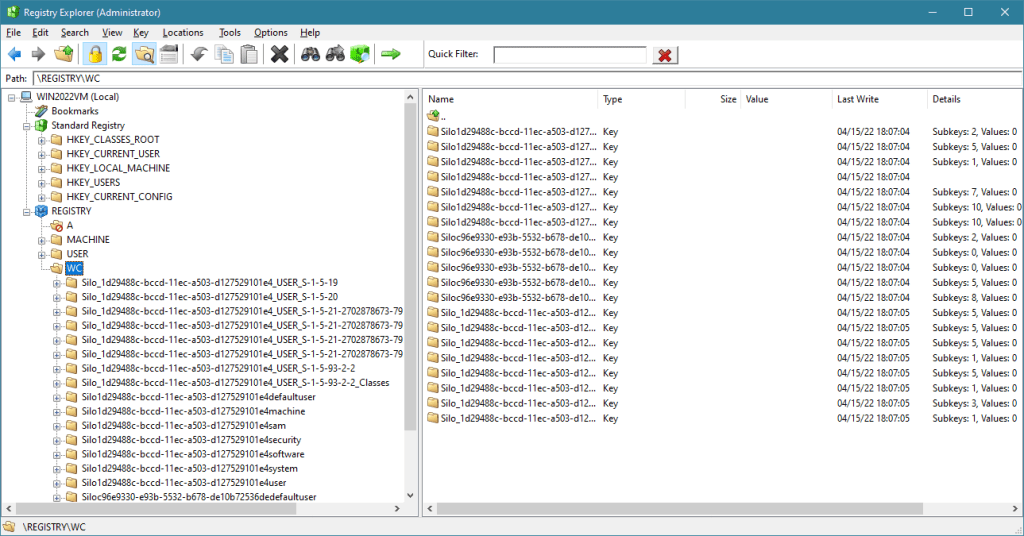
Finally, the WC key is used for Windows Container, internally called Silos. A container (like the ones created by Docker) is an isolated instance of a user-mode OS, kind of like a lightweight virtual machine, but the kernel is not separate (as would be with a true VM), but is provided by the host. Silos are very interesting, but outside the scope of this post.
Briefly, there are two main Silo types: An Application Silo, which is not a true container, and mostly used with application based on the Desktop Bridge technology. A classic example is WinDbg Preview. The second type is Server Silo, which is a true container. A true container must have its file system, Registry, and Object Manager namespace virtualized. This is exactly the role of the WC subkeys – provide the private Registry keys for containers. The Configuration Manager (as well as other parts of the kernel) are Silo-aware, and will redirect Registry calls to the correct subkey, having no effect on the Host Registry or the private Registry of other Silos.
You can examine some aspects of silos with the kernel debugger !silo command. Here is an example from a server 2022 running a Server Silo and the Registry keys under WC:
There you have it. The relatively simple-looking Registry shown in RegEdit is viewed differently by the kernel. Device driver writers find this out relatively early – they cannot use the “abstractions” provided by user mode even if these are sometimes convenient.
My schedule has been a mess in recent months, and continues to be so for the next few months. However, I am opening registration today for the Windows Internals training with some date changes from my initial plan.
Here are the dates and times (all based on London time) – 5 days total:
July 6: 4pm to 12am (full day)
July 7: 4pm to 8pm
July 11: 4pm to 12am (full day)
July 12, 13, 14, 18, 19: 4pm to 8pm
Training cost is 800 USD, if paid by an individual, or 1500 USD if paid by a company. Participants from Ukraine (please provide some proof) are welcome with a 90% discount (paying 80 USD, individual payments only).
If you’d like to register, please send me an email to zodiacon@live.com with “Windows Internals training” in the title, provide your full name, company (if any), preferred contact email, and your time zone. The basic syllabus can be found here. if you’ve sent me an email before when I posted about my upcoming classes, you don’t have to do that again – I will send full details soon.
The sessions will be recorded, so can watch any part you may be missing, or that may be somewhat overwhelming in “real time”.
I am announcing the next Windows Internals remote training to be held in July 2021 on the 12, 14, 15, 19, 21. Times: 11am to 7pm, London time.
The syllabus can be found here (slight changes are possible if new important topics come up).
Cost and Registration
I’m keeping the cost of these training classes relatively low. This is to make these classes accessible to more people, especially in these unusual and challenging times.
Cost: 800 USD if paid by an individual, 1500 USD if paid by a company. Multiple participants from the same company are entitled to a discount (email me for the details). Previous students of my classes are entitled to a 10% discount.
To register, send an email to zodiacon@live.com and specify “Windows Internals Training” in the title. The email should include your name, contact email, and company name (if any).
Later this year I plan a Windows Kernel Programming class. Stay tuned!