Writing Your Own Programming Language

Ever since I realized BASIC wasn’t the only living programming language, I thought about writing my own. Who wouldn’t? If you’re a developer, surely this idea popped into your mind at some point. No matter how much you love a particular programming language, you always have some ideas for improvement or even removal of annoying features.

The post assumes you have some background in compilers, and understand concepts like tokenizing (scanning), parsing, and Abstract Syntax Trees (ASTs)

Obviously, writing a programming language is not for the faint of heart. Even before you set out to implement your language, you have to design it first. Or maybe you have some fundamental ideas that would make your language unique, and you may decide to flesh out the details while you’re implementing it.

A new programming language does not have to be “general-purpose” – that is, it could be a “domain specific language” (DSL), which means it’s best suited for certain domain(s) or tasks. This makes your life (usually) at least somewhat easier; in addition, you’ll be unlikely to compete with the gazillion general-purpose languages out there. Still, a general-purpose language might be your goal.

Designing a programming language is a big topic, well outside the scope of this post. I’ll focus on the implementation details, so to speak. There are other considerations for a programming language beyond the language itself – its accompanying standard library, tooling (e.g., some IDE or at least syntax highlighting), debugging, testing, and few more. One decision is whether to make your language compiled or interpreted. This decision may not affect some aspects of the implementation, but it will definitely affect the language’s back-end. You can even support both interpretation and compilation for maximum flexibility.

I played around with the idea of creating a programming language for many years, never really getting very far beyond a basic parser and a minimal interpreter. Lately, I’ve read more about Pratt Parsing, that sparked my interest again. Pratt Parsing is one of many techniques for parsing expressions, something like “a+2*b”, and doing that correctly (parenthesis, operator precedence and associativity). Pratt parsing is really elegant, much more so than other techniques, and it’s also more flexible, supporting (indirectly) ternary operations and other unusual constructs. Once you have an expression parser, the rest of the parser is fairly easy to implement (relatively speaking) using the recursive-descent approach which is well suited for hand-crafted parsers.

Robert Nystrom gives a nice introduction to Pratt Parsing and an elegant idea for implementing it. His implementation is in Java, but there is a link to a C# implementation and even one in Rust. My go-to language is C++ (still), so you know where this is going. I’ve implemented a Pratt parser based on Robert’s ideas, and it turned out very well.

I’ve also been interested in visualization (a term which has way too much stuffed into it), but I thought I’d start small. A popular teaching language in the 80s was LOGO. Although it was treated as a “toy language”, it was a full-blown language, mostly resembling LISP internally.

However, LOGO became famous because of the “Turtle Graphics” built-in support that was provided, which allowed drawing with an imaginary turtle (you could even ask LOGO to show it) that would follow your commands like moving forward, backwards, rotating, lifting the pen and putting it back down. Why not create a fun version of Turtle Graphics with ideas from LOGO?

Here is an example from LOGO to draw a symmetric hexagon:

REPEAT 6 [ FD 100 RT 60 ]

You can probably guess what is going on here. “FD” is “forward” and “RT” is “right”, although it could be mistaken for “rotate”. LOGO supported functions as well, so you could create complex shapes by reusing functions.

My language, called “Logo2” for a lack of originality at this time, tries to capture that fun drawing, but put the syntax more inline with the C-family of functions, which I like more. The above hexagon is written with Logo2 like so:

repeat 6 {
    fd(100); rt(60);
}

Indentation is not significant, so it all could be placed on the same line. You can also define functions and execute them:

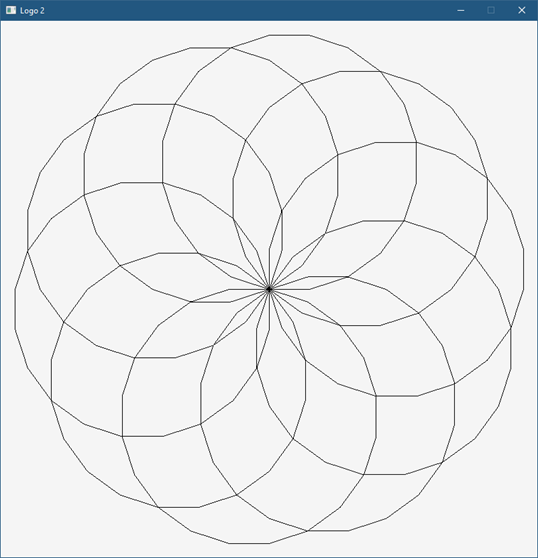
fn circle(size, steps) {
    repeat steps {
        fd(size); rt(360 / steps);
    }
}

repeat 10 {
    circle(80, 20); rt(36);
}

I also added support for colors, with the pencolor(r,g,b) function, something I don’t recall LOGO having in the 80s.

Implementation

There are 3 main projects in the solution (a fourth project in the works to create a simple IDE for easier experimentation):

  • Logo2Core – contains the tokenizer, parser, and interpreter.
  • Logo2Runtime – contains the runtime support for turtle graphics, currently using GDI+.
  • Logo2 – is a simple REPL, that can parse and execute single line statements. If you provide a command line argument, it’s treated as file name to be parsed and executed. Anything not inside a function is executed directly (for now).

The Tokenizer

The tokenizer’s job (Tokenizer class) is to read text and turn it into a bunch of tokens. A token is a single unit of the language, like a number, keyword, identifier, operator, etc. To start tokenization, the Tokenize method can be invoked with the string to tokenize.

The Next() method returns the next token, whereas the Peek() method returns the next token without advancing the stream forward. This means the tokenizer is not doing all the work immediately, but only advanced to the next token when requested. The parser is the one “driving” the tokenizer.

The implementation of the tokenizer is not perfect, but it works well-enough. I didn’t want to use any existing tools like YACC (or BISON), for a couple reasons. For one, I don’t like generated code that I have little control colover. Second, I like to understand what I am writing. Writing a tokenizer is not rocket science, but it’s not trivial, either. And since one of my goals is to experiment, I need the freedom not available with generated code.

The Parser

The parser is much more interesting than the tokenizer (by far). This is where the syntax of the language is fleshed out. Just like with tokenization, usage of tools like LEX (or FLEX) is inappropriate. In fact, most languages have their own hand-written parser. The parser accepts a string to parse (Parse method) or a filename (ParseFile method) and begins the parsing. It calls on the tokenizer when the next token is needed.

The Init method of the parser initializes the tokenizer with the specific tokens it should be able to recognize (like specific keywords and operators), and also initializes its own “parslets” (defined in the above mentioned article) to make Pratt Parsing work. I will not show here the Pratt Parsing part since there’s quite a bit of code there, but here is an example of parsing the “repeat” statement:

std::unique_ptr<RepeatStatement> Parser::ParseRepeatStatement() {
	Next();		// eat "repeat"
	auto times = ParseExpression();

	m_LoopCount++;
	auto block = ParseBlock();
	m_LoopCount--;
    return std::make_unique<RepeatStatement>(
        std::move(times), std::move(block));
}

ParseExpression parses an expression to be used for the argument to repeat. Then ParseBlock is called to parse a curly-brace surrounded block of code. Finally, the result is an AST node representing a “repeat” statement is created, initialized, and returned to the caller.

The m_LoopCount variable is incremented when entering loop parsing and decremented afterwards. This is done so that parsing the keywords break and continue can check if there is any enclosing loop for these keywords to make sense.

Here is ParseBlock:

std::unique_ptr<BlockExpression>
Parser::ParseBlock(std::vector<std::string> const& args) {
	if (!Match(TokenType::OpenBrace))
		AddError(ParserError(ParseErrorType::OpenBraceExpected, Peek()));

	m_Symbols.push(std::make_unique<SymbolTable>(m_Symbols.top().get()));

	for (auto& arg : args) {
		Symbol sym;
		sym.Name = arg;
		sym.Flags = SymbolFlags::None;
		sym.Type = SymbolType::Argument;
		AddSymbol(sym);
	}

	auto block = std::make_unique<BlockExpression>();
	while (Peek().Type != TokenType::CloseBrace) {
		auto stmt = ParseStatement();
		if (!stmt)
			break;
		block->Add(std::move(stmt));
	}
	Next();		// eat close brace
	m_Symbols.pop();
	return block;
}

ParseBlock starts by making sure there is an open curly brace. Then it creates a symbol table and pushes it to be the “current” as there is a new scope within the block. The parameter to ParseBlock is used when parsing a function body, where these “args” are the parameters to the function. If this is the case, they are added to the symbol table as local variables.

The main work is to call ParseStatement as many times as needed until a close brace is encountered. The block is a vector of statements being filled up. Finally, the symbol table is popped and the AST node is returned.

ParseStatement is a big switch that calls the appropriate specific parsing method based on the first token encountered. Here is an excerpt:

std::unique_ptr<Statement> Parser::ParseStatement() {
	auto peek = Peek();
	if (peek.Type == TokenType::Invalid) {
		return nullptr;
	}

	switch (peek.Type) {
		case TokenType::Keyword_Var: 
             return ParseVarConstStatement(false);
		case TokenType::Keyword_Const: 
             return ParseVarConstStatement(true);
		case TokenType::Keyword_Repeat: 
             return ParseRepeatStatement();
		case TokenType::Keyword_While: 
             return ParseWhileStatement();
		case TokenType::Keyword_Fn: 
             return ParseFunctionDeclaration();
		case TokenType::Keyword_Return: 
             return ParseReturnStatement();
        case TokenType::Keyword_Break: 
             return ParseBreakContinueStatement(false);
        case TokenType::Keyword_Continue:
             return ParseBreakContinueStatement(true);
	}
	auto expr = ParseExpression();
	if (expr) {
		Match(TokenType::SemiColon);
		return std::make_unique<ExpressionStatement>(std::move(expr));
	}
	AddError(ParserError(ParseErrorType::InvalidStatement, peek));
	return nullptr;
}

If a statement is not recognized, an expression parsing is attempted. This allows using Logo2 as a simple calculator, for example. ParseStatement is where the support for more statements is added based on an initial token.

Once an AST is built by the parser, the next step is to execute the AST by some interpreter. In a more complex language (maybe once it grows some more), some semantic analysis may be appropriate, which is about looking at the usage of the language beyond the syntax. For now, we’ll just interpret what we have, and if any error is encountered it’s going to be a runtime error. Some parsing errors can be caught without semantic analysis, but some cannot.

The Interpreter

The Interpreter class provides the runtime behavior, by “executing” the AST. It receives the root of the AST tree constructed by the parser by implementing the well-known Visitor design pattern, whose purpose here is to decouple between the AST node types and the way they are handled by the interpreter. Alternatively, it would be possible to add a virtual “Execute” or “Eval” method to AST nodes, so the nodes can “evaluate” themselves, but that creates coupling, and goes against the single-responsibility principle (SRP) that states that a class should have one and only one job. Using the visitor pattern also makes it easier to add semantic analysis later without modifying the AST node types.

The gist of the visitor pattern is to have an “Accept” method in the AST nodes that calls back to whoever (the visitor) with the current node details. For example, here it is for a binary operator:

class BinaryExpression : public Expression {
public:
    BinaryExpression(std::unique_ptr<Expression> left, 
        Token op, std::unique_ptr<Expression> right);
	Value Accept(Visitor* visitor) const override;

	std::string ToString() const override;

	Expression* Left() const;
	Expression* Right() const;
	Token const& Operator() const;

private:
	std::unique_ptr<Expression> m_Left, m_Right;
	Token m_Operator;
};

Value BinaryExpression::Accept(Visitor* visitor) const {
	return visitor->VisitBinary(this);
}

This same idea is repeated for all concrete AST nodes. The Visitor type is abstract, implemented by the Interpreter class having methods like: VisitBinary, VisitRepeat, etc.

Each one of these “Visit” method’s purpose is to “execute” (or evaluate) that node. Here is an excerpt for the binary expression visiting:

Value Interpreter::VisitBinary(BinaryExpression const* expr) {
    switch (expr->Operator().Type) {
    case TokenType::Add: 
       return expr->Left()->Accept(this) + expr->Right()->Accept(this);
    case TokenType::Sub:
       return expr->Left()->Accept(this) - expr->Right()->Accept(this);
    case TokenType::Mul:
       return expr->Left()->Accept(this) * expr->Right()->Accept(this);
    case TokenType::Div:
       return expr->Left()->Accept(this) / expr->Right()->Accept(this);
    }
    return Value();
}

Here it is for “repeat”:

Value Interpreter::VisitRepeat(RepeatStatement const* expr) {
    auto count = Eval(expr->Count());
    if (!count.IsInteger())
        throw RuntimeError(ErrorType::TypeMismatch, expr->Count());

    auto n = count.Integer();
    while (n-- > 0) {
        try {
            Eval(expr->Block());
        }
        catch (BreakOrContinue const& bc) {
            if (!bc.Continue)
                break;
        }
    }
    return nullptr;     // repeat has no return value
}

You should get the idea at this point. (Eval is just a simple wrapper that calls Accept with the provided node).

The Value type used with the above code (the one returned from Accept methods is the way to represent “values” in Logo2. Logo2 is a dynamically typed language (at least for now), so variables can hold any one of a listed of supported types, encapsulated in Value. You can think of that as a C-style union. Specifically, it wraps a std::variant<> C++17 type that currently supports the following: 64-bit integer, 64-bit floating point (double), bool, string (std::string), and null (representing no value). The list of possibilities will increase, allowing user-defined types as well.

Turtle Graphics

The Logo2Runtime project contains the support for managing turtles, and displaying their “drawings”. The Turtle class is a graphics-free type to manage the state of the turtle – its position and heading, but also a list of “command” indicating operations the turtle has been instructed to do, such as drawing a line, changing color, or changing width of drawing. This list is necessary whenever a window’s output needs to be refreshed.

The Window class servers as a wrapper for an HWND, that also has the “power” to draw a set of turtle commands. Here is its DrawTurtle method:

void Window::DrawTurtle(Gdiplus::Graphics& g, Turtle* t) const {
    for (auto& cmd : t->GetCommands()) {
        DrawTurtleCommand(g, t, cmd);
    }
}

Each command does the right thing:

void Window::DrawTurtleCommand(Gdiplus::Graphics& g, Turtle* t, 
    TurtleCommand const& cmd) const {
    switch (cmd.Type) {
        case TurtleCommandType::DrawLine:
            g.DrawLine(m_Pen.get(), cmd.Line.From.X, 
               cmd.Line.From.Y, cmd.Line.To.X, cmd.Line.To.Y);
            break;

        case TurtleCommandType::SetWidth:
        {
            Color color;
            m_Pen->GetColor(&color);
            m_Pen.reset(new Pen(color, cmd.Width));
            break;
        }

        case TurtleCommandType::SetColor:
        {
            Color color;
            color.SetValue(cmd.Color);
            m_Pen.reset(new Pen(color, m_Pen->GetWidth()));
            break;
        }
    }
}

The graphical objects are GDI+ objects provided by the Windows API. Of course, it would be possible to switch to a different API. I chose GDI+ for its flexibility and 2D capabilities.

The Runtime class ties a turtle and a window together. It holds on to a (single) Turtle object and single Window object. In the future, this is going to be more dynamic, so any number of windows and turtles can be created, even more than one turtle in the same window.

The REPL

A simple REPL is implemented in the Logo2 project. It’s not trivial, as there is a user interface that must be kept alive, meaning messages have to be pumped. This means using functions like gets_s is not good enough, as they block the calling thread. Assuming the UI is on the same thread, this will cause the UI to become non-responsive. For now, the same thread is used, so that no special synchronization is required. The downside is that a custom input “loop” has to be written, and currently it’s very simple, and only supports the BACKSPACE key for typing error correction.

The first step is to get the input, key by key. If there is no key available, messages are pumped. A WM_QUIT message indicates it’s time to exit. Not very elegant, but here goes:

Tokenizer t;
Parser parser(t);
Interpreter inter;
Runtime runtime(inter);
runtime.Init();
runtime.CreateLogoWindow(L"Logo 2", 800, 800);

for (;;) {
	std::print(">> ");
	std::string input;
	int ch = 0;
	MSG msg{};
	while (ch != 13) {
		while (::PeekMessage(&msg, nullptr, 0, 0, PM_REMOVE) && 
                 msg.message != WM_QUIT) {
			::TranslateMessage(&msg);
			::DispatchMessage(&msg);
		}
		if (msg.message == WM_QUIT)
			break;

		if (_kbhit()) {
			ch = _getch();
			if (isprint(ch)) {
				input += (char)ch;
				printf("%c", ch);
			}
			else if (ch == 8) {		// backspace
				printf("\b \b");
				input = input.substr(0, input.length() - 1);
			}
			else {
				if (_kbhit())
					_getch();
			}
		}
	}

	if (msg.message == WM_QUIT)
		break;

Once we have a line of input, it’s time to parse and (if no errors occur), execute:

try {
	printf("\n");
	auto ast = parser.Parse(input);
	if (parser.HasErrors()) {
		for (auto& err : parser.Errors()) {
			printf("Error (%d,%d): %d\n", 
               err.ErrorToken.Line, err.ErrorToken.Col, err.Error);
		}
		continue;
	}
	try {
		auto result = ast->Accept(&inter); // execute!
		if (result != nullptr)
			std::println("{}", result.ToString());
	}
	catch (RuntimeError const& err) {
		printf("Runtime error: %d\n", (int)err.Error);
	}
}
catch (ParserError const& err) {
	printf("Error (%d,%d): %d\n", err.ErrorToken.Line, 
         err.ErrorToken.Col, err.Error);
	continue;
}

Some parser errors are accumulated in a vector, some throw an exception (errors where it would be difficult for the parser to recover confidently). At runtime, errors could occur as well, such as the wrong types being used with certain operations.

Conclusion

Writing a language can be lots of fun. You can invent your “dream” language. For me, the Logo2 experiment is ongoing. I’m planning to build a simple IDE, to extend the language to support user-defined types, lambdas (with closures), and much more. Your ideas are welcome as well!

The project is at zodiacon/Logo2 (github.com)

Thread Priorities in Windows

When a thread is created, it has some priority, which sets its importance compared to other threads competing for CPU time. The thread priority range is 0 to 31 (31 being the highest), where priority zero is used by the memory manager’s zero-page thread(s), whose purpose is to zero out physical pages (for reasons outside the scope of this post), so technically the allowed priority range is 1 to 31.

It stands to reason (to some extent), that a developer could change a thread’s priority to some valid value in the range of 1 to 31, but this is not the case. The Windows API sets up rules as to how thread priorities may change. First, there is a process priority class (sometimes called Base Priority), that specifies the default thread priority within that process. Processes don’t run – threads do, but still this is a process property and affects all threads in the process. You can see the value of this property very simply with Task Manager’s Base Priority column (not visible by default):

Base Priority column in Task Manager

There are six priority classes (the priority of which is specified after the colon):

  • Idle (called Low in Task Manager, probably not to give the wrong impression): 4
  • Below Normal (6)
  • Normal (8)
  • Above Normal (10)
  • Highest (13)
  • Realtime (24)

A few required notes:

  • Normal is the default priority class unless overridden in some way. For example, double-clicking an executable in Explorer will launch a new process with priority class of Normal (8).
  • The term “Realtime” does not imply Windows is a real-time OS; it’s not. “Real-time” just means “higher than all the others”.
  • To set the Realtime priority class, the process in question must have the SeIncreaseBasePriorityPrivilege, normally granted to administrators. If “Realtime” is requested, but the process’s token does not poses that privilege, the result is “High”. The reason has do to with the fact that many kernel threads have priorities in the real-time range, and it could be problematic if too many threads spend a lot of time running in these priorities, potentially leading to kernel threads getting less time than they need.

Is this the end of the story? Not quite. For example, looking at Task Manager, processes like Csrss.exe (Windows subsystem process) or Smss.exe (Session manager) seem to have a priority class of Normal as well. Is this really the case? Yes and no (everyone likes that kind of answer, right?) We’ll get to that soon.

Setting a Thread’s priority

Changing the process priority class is possible with the SetPriorityClass API. For example, a process can change its own priority class like so:

::SetPriorityClass(::GetCurrentProcess(), HIGH_PRIORITY_CLASS);

You can do the same in .NET by utilizing the System.Diagnostics.Process class:

Process.GetCurrentProcess().PriorityClass = ProcessPriorityClass.High;

You can also change priority class using Task Manager or Process Explorer, by right-clicking a process and selecting “Set Priority”.

Once the priority class is changed, it affects all threads in that process. But how?

It turns out that a specific thread’s priority can be changed around the process priority class. The following diagram shows the full picture:

Every small rectangle in the above diagram indicates a valid thread priority. For example, the Normal priority classes allows setting thread priorities to 1, 6, 7, 8, 9, 10, 15. To be more generic, here are the rules for all except the Realtime class. A thread priority is by default the same as the process priority class, but it can be -1, -2, +1, +2 from that base, or have two extreme values (internally called “Saturation”) with the values 1 and 15.

The Realtime range is unique, where the base priority is 24, but all priorities from 16 to 31 are available. The SetThreadPriority API that can be used to change an individual thread’s priority accepts an enumeration value (as its second argument) rather than an absolute value. Here are the macro definitions:

#define THREAD_PRIORITY_LOWEST         // -2  
#define THREAD_PRIORITY_BELOW_NORMAL   // -1
#define THREAD_PRIORITY_NORMAL         // 0
#define THREAD_PRIORITY_HIGHEST        // + 2
#define THREAD_PRIORITY_ABOVE_NORMAL   // + 1
#define THREAD_PRIORITY_TIME_CRITICAL  // 15 or 31
#define THREAD_PRIORITY_IDLE           // 1 or 16

Here is an example of changing the current thread’s priority to +2 compared to the process priority class:

::SetThreadPriority(::GetCurrentThread(), THREAD_PRIORITY_HIGHEST);

And a C# version:

Thread.CurrentThread.Priority = ThreadPriority.Highest;

You can see threads priorities in Process Explorer‘s bottom view:

Thread priorities in Process Explorer

There are two columns for priorities – A base priority and a Dynamic priority. The base priority is the priority set by code (SetThreadPriority) or the default, while the dynamic priority is the current thread’s priority, which could be slightly higher than the base (temporarily), and is changed because of certain decisions made by the kernel scheduler and other components and drivers that can produce such an effect. These thread boosting scenarios are outside the scope of this post.

If you want to see all threads in the system with their priorities, you can use my System Explorer tool, and select System / Threads menu item:

System Explorer showing all threads in the system

The two priority column are shown (Priority is the same as Dynamic Priority in Process Explorer). You can sort by any column, including the priority to see which threads have the highest priority.

Native APIs

If you look in Process Explorer, there is a column named Base Priority under the Process Performance tab:

Process Performance tab

With this column visible, it indicates a process priority with a number. It’s mostly the corresponding number to the priority class (e.g. 10 for Above Normal, 13 for High, etc.), but not always. For example, Smss.exe has a value of 11, which doesn’t correspond to any priority class. Csrss.exe processes have a value of 13.

Changing to these numbers can only be done with the Native API. Specifically, NtSetInformationProcess with the ProcessBasePriority enumeration value can make that change. Weirdly enough, if the value is higher than the current process priority, the same privilege mentioned earlier is required. The weird part, is that calling SetPriorityClass to change Normal to High always works, but calling NtSetInformationProcess to change from 8 to 13 (the same as Normal to High) requires that privilege; oh, well.

What about a specific thread? The native API allows changing a priority of a thread to any given value directly without the need to depend on the process priority class. Choosing a priority in the realtime range (16 or higher) still requires that privilege. But at least you get the flexibility to choose any priority value. The call to use is NtSetInformationThread with ThreadPriority enumeration. For example:

KPRIORITY priority = 14;
NtSetInformationThread(NtCurrentThread(), ThreadPriority, 
    &priority, sizeof(priority));

Note: the definitions for the native API can be obtained from the phnt project.

What happens if you need a high priority (16 or higher) but don’t have admin privileges in the process? Enter the Multimedia Class Scheduler.

The MMCSS Service

The multimedia class service coupled with a driver (mmcss.sys) provide a thread priority service intended for “multimedia” applications that would like to get some guarantee when “playing” multimedia. For example, if you have Spotify running locally, you’ll find there is one thread with priority 22, although the process itself has a priority class Normal:

Spotify threads

You can use the MMCSS API to get that kind of support. There is a Registry key that defines several “tasks” applications can use. Third parties can add more tasks:

MMCSS tasks

The base key is: HKLM\SOFTWARE\Microsoft\Windows NT\CurrentVersion\Multimedia\SystemProfile\Tasks

The selected “Audio” task has several properties that are read by the MMCSS service. The most important is Priority, which is between 1 (low) and 8 (high) representing the relative priority compared to other “tasks”. Some values aren’t currently used (GPU Priority, SFIO Priority), so don’t expect anything from these.

Here is an example that uses the MMCSS API to increase the current thread’s priority:

#include <Windows.h>
#include <avrt.h>

#pragma comment(lib, "avrt")

int main() {
	DWORD index = 0;
    HANDLE h = AvSetMmThreadCharacteristics(L"Audio", &index);
	AvSetMmThreadPriority(h, AVRT_PRIORITY_HIGH);

The priority itself is an enumeration, where each value corresponds to a range of priorities (all above 15).

The returned HANDLE by the way, is to the MMCSS device (\Device\MMCSS). The argument to AvSetMmThreadCharacteristics must correspond to one of the “Tasks” registered. Calling AvRevertMmThreadCharacteristics reverts the thread to “normal”. There are more APIs in that set, check the docs.

Happy Threading!

Window Stations and Desktops

A while back I blogged about the differences between the virtual desktop feature exposed to users on Windows 10/11, and the Desktops tool from Sysinternals. In this post, I’d like to shed some more light on Window Stations, desktops, and windows. I assume you have read the aforementioned blog post before continuing.

We know that Window Stations are contained in sessions. Can we enumerate these? The EnumWindowStations API is available in the Windows API, but it only returns the Windows Stations in the current session. There is no “EnumSessionWindowStations”. Window Stations, however, are named objects, and so are visible in tools such as WinObj (running elevated):

Window stations in session 0

The Window Stations in session 0 are at \Windows\WindowStations
The Window Stations in session x are at \Sessions\x\Windows\WindowStations

The OpenWindowStation API only accepts a “local” name, under the callers session. The native NtUserOpenWindowStation API (from Win32u.dll) is more flexible, accepting a full object name:

HWINSTA NtUserOpenWindowStation(POBJECT_ATTRIBUTES attr, ACCESS_MASK access);

Here is an example that opens the “msswindowstation” Window Station:

#include <Windows.h>
#include <winternl.h>

#pragma comment(lib, "ntdll")

HWINSTA NTAPI _NtUserOpenWindowStation(_In_ POBJECT_ATTRIBUTES attr, _In_ ACCESS_MASK access);
int main() {
	// force Win32u.DLL to load
	::LoadLibrary(L"user32");
	auto NtUserOpenWindowStation = (decltype(_NtUserOpenWindowStation)*)
		::GetProcAddress(::GetModuleHandle(L"win32u"), "NtUserOpenWindowStation");

	UNICODE_STRING winStaName;
	RtlInitUnicodeString(&winStaName, L"\\Windows\\WindowStations\\msswindowstation");
	OBJECT_ATTRIBUTES winStaAttr;
	InitializeObjectAttributes(&winStaAttr, &winStaName, 0, nullptr, nullptr);
	auto hWinSta = NtUserOpenWindowStation(&winStaAttr, READ_CONTROL);
	if (hWinSta) {
        // do something with hWinSta
        ::CloseWindowStation(hWinSta);
    }

You may or may not have enough power to open a handle with the required access – depending on the Window Station in question. Those in session 0 are hardly accessible from non-session 0 processes, even with the SYSTEM account. You can examine their security descriptor with the kernel debugger (as other tools will return access denied):

lkd> !object \Windows\WindowStations\msswindowstation
Object: ffffe103f5321c00  Type: (ffffe103bb0f0ae0) WindowStation
    ObjectHeader: ffffe103f5321bd0 (new version)
    HandleCount: 4  PointerCount: 98285
    Directory Object: ffff808433e412b0  Name: msswindowstation
lkd> dt nt!_OBJECT_HEADER ffffe103f5321bd0

   +0x000 PointerCount     : 0n98285
   +0x008 HandleCount      : 0n4
   +0x008 NextToFree       : 0x00000000`00000004 Void
   +0x010 Lock             : _EX_PUSH_LOCK
   +0x018 TypeIndex        : 0xa2 ''
   +0x019 TraceFlags       : 0 ''
   +0x019 DbgRefTrace      : 0y0
   +0x019 DbgTracePermanent : 0y0
   +0x01a InfoMask         : 0xe ''
   +0x01b Flags            : 0 ''
   +0x01b NewObject        : 0y0
   +0x01b KernelObject     : 0y0
   +0x01b KernelOnlyAccess : 0y0
   +0x01b ExclusiveObject  : 0y0
   +0x01b PermanentObject  : 0y0
   +0x01b DefaultSecurityQuota : 0y0
   +0x01b SingleHandleEntry : 0y0
   +0x01b DeletedInline    : 0y0
   +0x01c Reserved         : 0
   +0x020 ObjectCreateInfo : 0xfffff801`21c53940 _OBJECT_CREATE_INFORMATION
   +0x020 QuotaBlockCharged : 0xfffff801`21c53940 Void
   +0x028 SecurityDescriptor : 0xffff8084`3da8aa6c Void
   +0x030 Body             : _QUAD
lkd> !sd 0xffff8084`3da8aa60
->Revision: 0x1
->Sbz1    : 0x0
->Control : 0x8014
            SE_DACL_PRESENT
            SE_SACL_PRESENT
            SE_SELF_RELATIVE
->Owner   : S-1-5-18
->Group   : S-1-5-18
->Dacl    : 
->Dacl    : ->AclRevision: 0x2
->Dacl    : ->Sbz1       : 0x0
->Dacl    : ->AclSize    : 0x1c
->Dacl    : ->AceCount   : 0x1
->Dacl    : ->Sbz2       : 0x0
->Dacl    : ->Ace[0]: ->AceType: ACCESS_ALLOWED_ACE_TYPE
->Dacl    : ->Ace[0]: ->AceFlags: 0x0
->Dacl    : ->Ace[0]: ->AceSize: 0x14
->Dacl    : ->Ace[0]: ->Mask : 0x0000011b
->Dacl    : ->Ace[0]: ->SID: S-1-1-0

You can become SYSTEM to help with access by using PsExec from Sysinternals to launch a command window (or whatever) as SYSTEM but still run in the interactive session:

psexec -s -i -d cmd.exe

If all else fails, you may need to use the “Take Ownership” privilege to make yourself the owner of the object and change its DACL to allow yourself full access. Apparently, even that won’t work, as getting something from a Window Station in another session seems to be blocked (see replies in Twitter thread). READ_CONTROL is available to get some basic info.

Here is a screenshot of Object Explorer running under SYSTEM that shows some details of the “msswindowstation” Window Station:

Guess which processes hold handles to this hidden Windows Station?

Once you are able to get a Window Station handle, you may be able to go one step deeper by enumerating desktops, if you managed to get at least WINSTA_ENUMDESKTOPS access mask:

::EnumDesktops(hWinSta, [](auto deskname, auto param) -> BOOL {
	printf(" Desktop: %ws\n", deskname);
	auto h = (HWINSTA)param;
	return TRUE;
	}, (LPARAM)hWinSta);

Going one level deeper, you can enumerate the top-level windows in each desktop (if any). For that you will need to connect the process to the Window Station of interest and then call EnumDesktopWindows:

void DoEnumDesktopWindows(HWINSTA hWinSta, PCWSTR name) {
	if (::SetProcessWindowStation(hWinSta)) {
		auto hdesk = ::OpenDesktop(name, 0, FALSE, DESKTOP_READOBJECTS);
		if (!hdesk) {
			printf("--- failed to open desktop %ws (%d)\n", name, ::GetLastError());
			return;
		}
		static WCHAR pname[MAX_PATH];
		::EnumDesktopWindows(hdesk, [](auto hwnd, auto) -> BOOL {
			static WCHAR text[64];
			if (::IsWindowVisible(hwnd) && ::GetWindowText(hwnd, text, _countof(text)) > 0) {
				DWORD pid;
				auto tid = ::GetWindowThreadProcessId(hwnd, &pid);
				auto hProcess = ::OpenProcess(PROCESS_QUERY_LIMITED_INFORMATION, FALSE, pid);
				BOOL exeNameFound = FALSE;
				PWSTR exeName = nullptr;
				if (hProcess) {
					DWORD size = MAX_PATH;
					exeNameFound = ::QueryFullProcessImageName(hProcess, 0, pname, &size);
					::CloseHandle(hProcess);
					if (exeNameFound) {
						exeName = ::wcsrchr(pname, L'\\');
						if (exeName == nullptr)
							exeName = pname;
						else
							exeName++;
					}
				}
				printf("  HWND: 0x%08X PID: 0x%X (%d) %ws TID: 0x%X (%d): %ws\n", 
					(DWORD)(DWORD_PTR)hwnd, pid, pid, 
					exeNameFound ? exeName : L"", tid, tid, text);
			}
			return TRUE;
			}, 0);
		::CloseDesktop(hdesk);
	}
}

Calling SetProcessWindowStation can only work with a Windows Station that belongs to the current session.

Here is an example output for the interactive session (Window Stations enumerated with EnumWindowStations):

Window station: WinSta0
 Desktop: Default
  HWND: 0x00010E38 PID: 0x4D04 (19716) Zoom.exe TID: 0x5FF8 (24568): ZPToolBarParentWnd
  HWND: 0x000A1C7A PID: 0xB804 (47108) VsDebugConsole.exe TID: 0xDB50 (56144): D:\Dev\winsta\x64\Debug\winsta.exe
  HWND: 0x00031DE8 PID: 0xBF40 (48960) devenv.exe TID: 0x94E8 (38120): winsta - Microsoft Visual Studio Preview
  HWND: 0x00031526 PID: 0x1384 (4996) msedge.exe TID: 0xE7C (3708): zodiacon/ObjectExplorer: Explore Kernel Objects on Windows and
  HWND: 0x00171A9A PID: 0xA40C (41996)  TID: 0x9C08 (39944): WindowStation (\Windows\WindowStations\msswindowstation)
  HWND: 0x000319D0 PID: 0xA40C (41996)  TID: 0x9C08 (39944): Object Manager - Object Explorer 2.0.2.0 (Administrator)
  HWND: 0x001117DC PID: 0x253C (9532) ObjExp.exe TID: 0x9E10 (40464): Object Manager - Object Explorer 2.0.2.0 (Administrator)
  HWND: 0x00031CA8 PID: 0xBE5C (48732) devenv.exe TID: 0xC250 (49744): OpenWinSta - Microsoft Visual Studio Preview (Administrator)
  HWND: 0x000B1884 PID: 0xA8A0 (43168) DbgX.Shell.exe TID: 0xA668 (42600):  - KD '', Local Connection  - WinDbg 1.2306.12001.0 (Administra
...
  HWND: 0x000101C8 PID: 0x3598 (13720) explorer.exe TID: 0x359C (13724): Program Manager
Window station: Service-0x0-45193$
 Desktop: sbox_alternate_desktop_0x6A80
 Desktop: sbox_alternate_desktop_0xA94C
 Desktop: sbox_alternate_desktop_0x3D8C
 Desktop: sbox_alternate_desktop_0x7EF8
 Desktop: sbox_alternate_desktop_0x72FC
 Desktop: sbox_alternate_desktop_0x27B4
 Desktop: sbox_alternate_desktop_0x6E80
 Desktop: sbox_alternate_desktop_0x6C54
 Desktop: sbox_alternate_desktop_0x68C8
 Desktop: sbox_alternate_desktop_0x691C
 Desktop: sbox_alternate_desktop_0x4150
 Desktop: sbox_alternate_desktop_0x6254
 Desktop: sbox_alternate_desktop_0x5B9C
 Desktop: sbox_alternate_desktop_0x59B4
 Desktop: sbox_alternate_desktop_0x1384
 Desktop: sbox_alternate_desktop_0x5480

The desktops in the Window Station “Service-0x0-45193$” above don’t seem to have top-level visible windows.

You can also access the clipboard and atom table of a given Windows Station, if you have a powerful enough handle. I’ll leave that as an exercise as well.

Finally, what about session enumeration? That’s the easy part – no need to call NtOpenSession with Session objects that can be found in the “\KernelObjects” directory in the Object Manager’s namespace – the WTS family of functions can be used. Specifically, WTSEnumerateSessionsEx can provide some important properties of a session:

void EnumSessions() {
	DWORD level = 1;
	PWTS_SESSION_INFO_1 info;
	DWORD count = 0;
	::WTSEnumerateSessionsEx(WTS_CURRENT_SERVER_HANDLE, &level, 0, &info, &count);
	for (DWORD i = 0; i < count; i++) {
		auto& data = info[i];
		printf("Session %d (%ws) Username: %ws\\%ws State: %s\n", data.SessionId, data.pSessionName, 
			data.pDomainName ? data.pDomainName : L"NT AUTHORITY", data.pUserName ? data.pUserName : L"SYSTEM", 
			StateToString((WindowStationState)data.State));
    }
	::WTSFreeMemory(info);
}

What about creating a process to use a different Window Station and desktop? One member of the STARTUPINFO structure passed to CreateProcess (lpDesktop) allows setting a desktop name and an optional Windows Station name separated by a backslash (e.g. “MyWinSta\MyDesktop”).

There is more to Window Stations and Desktops that meets the eye… this should give interested readers a head start in doing further research.

Kernel Object Names Lifetime

Much of the Windows kernel functionality is exposed via kernel objects. Processes, threads, events, desktops, semaphores, and many other object types exist. Some object types can have string-based names, which means they can be “looked up” by that name. In this post, I’d like to consider some subtleties that concern object names.

Let’s start by examining kernel object handles in Process Explorer. When we select a process of interest, we can see the list of handles in one of the bottom views:

Handles view in Process Explorer

However, Process Explorer shows what it considers handles to named objects only by default. But even that is not quite right. You will find certain object types in this view that don’t have string-based names. The simplest example is processes. Processes have numeric IDs, rather than string-based names. Still, Process Explorer shows processes with a “name” that shows the process executable name and its unique process ID. This is useful information, for sure, but it’s not the object’s name.

Same goes for threads: these are displayed, even though threads (like processes) have numeric IDs rather than string-based names.

If you wish to see all handles in a process, you need to check the menu item Show Unnamed Handles and Mappings in the View menu.

Object Name Lifetime

What is the lifetime associated with an object’s name? This sounds like a weird question. Kernel objects are reference counted, so obviously when an object reference count drops to zero, it is destroyed, and its name is deleted as well. This is correct in part. Let’s look a bit deeper.

The following example code creates a Notepad process, and puts it into a named Job object (error handling omitted for brevity):

PROCESS_INFORMATION pi;
STARTUPINFO si = { sizeof(si) };

WCHAR name[] = L"notepad";
::CreateProcess(nullptr, name, nullptr, nullptr, FALSE, 0, 
	nullptr, nullptr, &si, &pi);

HANDLE hJob = ::CreateJobObject(nullptr, L"MyTestJob");
::AssignProcessToJobObject(hJob, pi.hProcess);

After running the above code, we can open Process Explorer, locate the new Notepad process, double-click it to get to its properties, and then navigate to the Job tab:

We can clearly see the job object’s name, prefixed with “\Sessions\1\BaseNamedObjects” because simple object names (like “MyTestJob”) are prepended with a session-relative directory name, making the name unique to this session only, which means processes in other sessions can create objects with the same name (“MyTestJob”) without any collision. Further details on names and sessions is outside the scope of this post.

Let’s see what the kernel debugger has to say regarding this job object:

lkd> !process 0 1 notepad.exe
PROCESS ffffad8cfe3f4080
    SessionId: 1  Cid: 6da0    Peb: 175b3b7000  ParentCid: 16994
    DirBase: 14aa86d000  ObjectTable: ffffc2851aa24540  HandleCount: 233.
    Image: notepad.exe
    VadRoot ffffad8d65d53d40 Vads 90 Clone 0 Private 524. Modified 0. Locked 0.
    DeviceMap ffffc28401714cc0
    Token                             ffffc285355e9060
    ElapsedTime                       00:04:55.078
    UserTime                          00:00:00.000
    KernelTime                        00:00:00.000
    QuotaPoolUsage[PagedPool]         214720
    QuotaPoolUsage[NonPagedPool]      12760
    Working Set Sizes (now,min,max)  (4052, 50, 345) (16208KB, 200KB, 1380KB)
    PeakWorkingSetSize                3972
    VirtualSize                       2101395 Mb
    PeakVirtualSize                   2101436 Mb
    PageFaultCount                    4126
    MemoryPriority                    BACKGROUND
    BasePriority                      8
    CommitCharge                      646
    Job                               ffffad8d14503080

lkd> !object ffffad8d14503080
Object: ffffad8d14503080  Type: (ffffad8cad8b7900) Job
    ObjectHeader: ffffad8d14503050 (new version)
    HandleCount: 1  PointerCount: 32768
    Directory Object: ffffc283fb072730  Name: MyTestJob

Clearly, there is a single handle to the job object. The PointerCount value is not the real reference count because of the kernel’s tracking of the number of usages each handle has (outside the scope of this post as well). To get the real reference count, we can click the PointerCount DML link in WinDbg (the !truref command):

kd> !trueref ffffad8d14503080
ffffad8d14503080: HandleCount: 1 PointerCount: 32768 RealPointerCount: 3

We have a reference count of 3, and since we have one handle, it means there are two references somewhere to this job object.

Now let’s see what happens when we close the job handle we’re holding:

::CloseHandle(hJob);

Reopening the Notepad’s process properties in Process Explorer shows this:

Running the !object command again on the job yields the following:

lkd> !object ffffad8d14503080
Object: ffffad8d14503080  Type: (ffffad8cad8b7900) Job
    ObjectHeader: ffffad8d14503050 (new version)
    HandleCount: 0  PointerCount: 1
    Directory Object: 00000000  Name: MyTestJob

The handle count dropped to zero because we closed our (only) existing handle to the job. The job object’s name seem to be intact at first glance, but not really: The directory object is NULL, which means the object’s name is no longer visible in the object manager’s namespace.

Is the job object alive? Clearly, yes, as the pointer (reference) count is 1. When the handle count it zero, the Pointer Count is the correct reference count, and there is no need to run the !truref command. At this point, you should be able to guess why the object is still alive, and where is that one reference coming from.

If you guessed “the Notepad process”, then you are right. When a process is added to a job, it adds a reference to the job object so that it remains alive if at least one process is part of the job.

We, however, have lost the only handle we have to the job object. Can we get it back knowing the object’s name?

hJob = ::OpenJobObject(JOB_OBJECT_QUERY, FALSE, L"MyTestJob");

This call fails, and GetLastError returns 2 (“the system cannot find the file specified”, which in this case is the job object’s name). This means that the object name is destroyed when the last handle of the object is closed, even if there are outstanding references on the object (the object is alive!).

This the job object example is just that. The same rules apply to any named object.

Is there a way to “preserve” the object name even if all handles are closed? Yes, it’s possible if the object is created as “Permanent”. Unfortunately, this capability is not exposed by the Windows API functions like CreateJobObject, CreateEvent, and all other create functions that accept an object name.

Quick update: The native NtMakePermanentObject can make an object permanent given a handle, if the caller has the SeCreatePermanent privilege. This privilege is not granted to any user/group by default.

A permanent object can be created with kernel APIs, where the flag OBJ_PERMANENT is specified as one of the attribute flags part of the OBJECT_ATTRIBUTES structure that is passed to every object creation API in the kernel.

A “canonical” kernel example is the creation of a callback object. Callback objects are only usable in kernel mode. They provide a way for a driver/kernel to expose notifications in a uniform way, and allow interested parties (drivers/kernel) to register for notifications based on that callback object. Callback objects are created with a name so that they can be looked up easily by interested parties. In fact, there are quite a few callback objects on a typical Windows system, mostly in the Callback object manager namespace:

Most of the above callback objects’ usage is undocumented, except three which are documented in the WDK (ProcessorAdd, PowerState, and SetSystemTime). Creating a callback object with the following code creates the callback object but the name disappears immediately, as the ExCreateCallback API returns an object pointer rather than a handle:

PCALLBACK_OBJECT cb;
UNICODE_STRING name = RTL_CONSTANT_STRING(L"\\Callback\\MyCallback");
OBJECT_ATTRIBUTES cbAttr = RTL_CONSTANT_OBJECT_ATTRIBUTES(&name, 
    OBJ_CASE_INSENSITIVE);
status = ExCreateCallback(&cb, &cbAttr, TRUE, TRUE);

The correct way to create a callback object is to add the OBJ_PERMANENT flag:

PCALLBACK_OBJECT cb;
UNICODE_STRING name = RTL_CONSTANT_STRING(L"\\Callback\\MyCallback");
OBJECT_ATTRIBUTES cbAttr = RTL_CONSTANT_OBJECT_ATTRIBUTES(&name, 
    OBJ_CASE_INSENSITIVE | OBJ_PERMANENT);
status = ExCreateCallback(&cb, &cbAttr, TRUE, TRUE);

A permanent object must be made “temporary” (the opposite of permanent) before actually dereferencing it by calling ObMakeTemporaryObject.

Aside: Getting to an Object’s Name in WinDbg

For those that wonder how to locate an object’s name give its address. I hope that it’s clear enough… (watch the bold text).

lkd> !object ffffad8d190c0080
Object: ffffad8d190c0080  Type: (ffffad8cad8b7900) Job
    ObjectHeader: ffffad8d190c0050 (new version)
    HandleCount: 1  PointerCount: 32770
    Directory Object: ffffc283fb072730  Name: MyTestJob
lkd> dt nt!_OBJECT_HEADER ffffad8d190c0050
   +0x000 PointerCount     : 0n32770
   +0x008 HandleCount      : 0n1
   +0x008 NextToFree       : 0x00000000`00000001 Void
   +0x010 Lock             : _EX_PUSH_LOCK
   +0x018 TypeIndex        : 0xe9 ''
   +0x019 TraceFlags       : 0 ''
   +0x019 DbgRefTrace      : 0y0
   +0x019 DbgTracePermanent : 0y0
   +0x01a InfoMask         : 0xa ''
   +0x01b Flags            : 0 ''
   +0x01b NewObject        : 0y0
   +0x01b KernelObject     : 0y0
   +0x01b KernelOnlyAccess : 0y0
   +0x01b ExclusiveObject  : 0y0
   +0x01b PermanentObject  : 0y0
   +0x01b DefaultSecurityQuota : 0y0
   +0x01b SingleHandleEntry : 0y0
   +0x01b DeletedInline    : 0y0
   +0x01c Reserved         : 0
   +0x020 ObjectCreateInfo : 0xffffad8c`d8e40cc0 _OBJECT_CREATE_INFORMATION
   +0x020 QuotaBlockCharged : 0xffffad8c`d8e40cc0 Void
   +0x028 SecurityDescriptor : 0xffffc284`3dd85eae Void
   +0x030 Body             : _QUAD
lkd> db nt!ObpInfoMaskToOffset L10
fffff807`72625e20  00 20 20 40 10 30 30 50-20 40 40 60 30 50 50 70  .  @.00P @@`0PPp
lkd> dx (nt!_OBJECT_HEADER_NAME_INFO*)(0xffffad8d190c0050 - ((char*)0xfffff807`72625e20)[(((nt!_OBJECT_HEADER*)0xffffad8d190c0050)->InfoMask & 3)])
(nt!_OBJECT_HEADER_NAME_INFO*)(0xffffad8d190c0050 - ((char*)0xfffff807`72625e20)[(((nt!_OBJECT_HEADER*)0xffffad8d190c0050)->InfoMask & 3)])                 : 0xffffad8d190c0030 [Type: _OBJECT_HEADER_NAME_INFO *]
    [+0x000] Directory        : 0xffffc283fb072730 [Type: _OBJECT_DIRECTORY *]
    [+0x008] Name             : "MyTestJob" [Type: _UNICODE_STRING]
    [+0x018] ReferenceCount   : 0 [Type: long]
    [+0x01c] Reserved         : 0x0 [Type: unsigned long]

Upcoming Training Classes for June & July

I’m happy to announce 3 upcoming remote training classes to be held in June and July.

Windows System Programming

This is a 5-day class, split into 10 half-days. The syllabus can be found here.

All times are 11am to 3pm ET (8am to 11am, PT) (4pm to 8pm, London time)

June: 7, 8, 12, 14, 15, 19, 21, 22, 26, 28

Cost: 950 USD if paid by an individual, 1900 USD if paid by a company.

COM Programming

This is a 3-day course, split into 6 half-days. The syllabus can be found here.

All times are 11am to 3pm ET (8am to 11am, PT) (4pm to 8pm, London time)

July: 10, 11, 12, 17, 18, 19

Cost: 750 USD (if paid by an individual), 1500 USD if paid by a company.

x64 Architecture and Programming

This is a brand new, 3 day class, split into 6 half-days, that covers the x64 processor architecture, programming in general, and programming in the context of Windows. The syllabus is not finalized yet, but it will cover at least the following topics:

  • General architecture and brief history
  • Registers
  • Addressing modes
  • Stand-alone assembly programs
  • Mixing assembly with C/C++
  • MSVC compiler-generated assembly
  • Operating modes: real, protected, long (+paging)
  • Major instruction groups
  • Macros
  • Shellcode
  • BIOS and assembly

July: 24, 25, 26, 31, August: 1, 2

Cost: 750 USD (if paid by an individual), 1500 USD if paid by a company.

Registration

If you’d like to register, please send me an email to zodiacon@live.com and provide the name of the training class of interest, your full name, company (if any), preferred contact email, and your time zone. Previous participants in my classes get 10% off. If you register for more than one class, the second (and third) are 10% off as well.

The sessions will be recorded, so you can watch any part you may be missing, or that may be somewhat overwhelming in “real time”.

As usual, if you have any questions, feel free to send me an email, or DM on twitter (@zodiacon) or Linkedin (https://www.linkedin.com/in/pavely/).

The Quest for the Ultimate GUI Framework

I love Graphical User Interfaces, especially the good ones 🙂 Some people feel more comfortable with a terminal and command line arguments – I prefer a graphical representation, especially when visualization of information can be much more effective than text (even if colorful).

Most of the tools I write are GUI tools; I like colors and graphics – computers are capable of so much graphic and visualization power – why not see it in all its glory? GUIs are not a silver bullet by any means. Sometimes bad GUIs are encountered, which might send the user to the command terminal. I’m not going to discuss here what makes up a good GUI. This post is about technologies to create GUIs.

Disclaimer: much of the rest of this post is subjective – my experience with Windows GUIs. I’m also not discussing web UI – not really in the same scope. I’m interested in taking advantage of the machine, not being constrained or affected by some browser or HTML/CSS/JS engine. The discussion is not exhaustive, either; there is a limit to a post 🙂

In the old days, the Win32 User Interface reined supreme. It was created in the days where memory was scarce, colors were few, hardware acceleration did not exist, and consistency was the name of the game. Modern GUIs were just starting to come up.

Windows supports all the standard controls (widgets) a typical GUI application would need. From buttons and menus, to list views and tree views, to edit controls, the standard set of typical application usage was covered. The basis of the Win32 GUI model was (and still is) the might Handle to Window (HWND). This entity represented the surface on which the window (typically a control) would render its graphical representation and handle its interaction logic. This worked fairly well throughout the 1990s and early 2000s.

The model was not perfect, but any means. Customizing controls was difficult, and in some cases downright impossible. Built-in customization was minimal, any substantial customization required subclassing – essentially taking control of handling some window messages differently in the hope of not breaking integration with the default message processing. It was a lot of work at best, and imperfect or impossible at worse. Messages like WM_PAINT and WM_ERASEBKGND were commonly overridden, but also mouse and keyboard-related messages. In some cases, there was no good option for customization and full blown control had to be written from scratch.

Here is a simple example: say you want to change the background color of a button. This should in theory be simple – change some property and you’re done. Not so easy with the Win32 button – it had to be owner-drawn or custom-drawn (WM_CUSTOMDRAW) in later versions of Windows. And that’s really a simple example.

Layout didn’t really exist. Controls were placed at an (x,y) coordinate measured from the top-left corner of the parent window – in pixels, mind you – with a specified width and height. There were no “panels” to handle more complex layout, in a grid for example, horizontally, or vertically, etc.

From a programmatic perspective, working directly with the Windows GUI API was no picnic either. Microsoft realized this, and developed The Microsoft Foundation Classes (MFC) library in the early 1990s to make working with Win32 GUI somewhat easier, by wrapping some of the functionality in C++ classes, and adding some nice features like docking windows. MFC was very popular at the time, as it was easier to use when getting started with building GUIs. It didn’t solve anything fundamental, as it was just using the Win32 GUI API under the covers. Several third-party libraries were written on top of MFC to provide even more functionality out of the box. MFC can still be used today, with Visual Studio still providing wizards and other helpers for MFC developers.

MFC wasn’t perfect of course. Beyond the obvious usage of the Win32 UI controls, it was fairly bloated, dragging with it a large DLL or adding a big static chunk if linked statically. Another library came out, the Windows Template Library (WTL), that provided a thin layer around the Windows GUI API, based on template classes, meaning that there was no “runtime” in the same sense as MFC – no library to link with – just whatever is compiled directly.

Personally, I like WTL a lot. In fact, my tools in recent years use WTL exclusively. It’s much more flexible than MFC, and doesn’t impose a particular way of working as MFC strongly did. The downside is that WTL wasn’t an official Microsoft library, mostly developed by good people inside the company in their spare time. Visual Studio has no special support for WTL. That said, WTL is still being maintained, and had some incremental features added throughout the years.

At the same time as MFC and WTL were used by C++ developers, another might tool entered the scene: Visual Basic. This environment was super successful for primary two reasons:

  • The programming language was based on BASIC, which many people had at least acquaintance with, as it was the most common programming language for personal computers in the 1980s and early 1990s.
  • The “Visual” aspect of Visual Basic was new and compelling. Just drag controls from a toolbox onto a surface, change properties in the designer and/or at runtime, connect to events easily, and you’re good to go.

To this day, I sometimes encounter customers and applications still built with Visual Basic 6, even though its official support date is long gone.

The .NET Era

At around 2002, .NET and C# were introduced by Microsoft as a response to the Java language and ecosystem that came out in 1995. With .NET, the Windows Forms (WinForms) library was provided, which was very similar to the Visual Basic experience, but with the more modern and powerful .NET Framework. And with .NET 2 in 2005, where .NET really kicked in (generics and other important features released), Windows Forms was the go-to UI framework while Visual Basic’s popularity somewhat waning.

However, WinForms was still based around the Win32 GUI model – HWNDs, no easy customization, etc. However, Microsoft did a lot of work to make WinForms more customizable than pure Win32 or MFC by subclassing many of the existing controls and adding functionality available with simple properties. Support was added to customize menus with colors and icons, buttons with images and custom colors, and more. The drag-n-drop experience from Visual Basic was available as well, making it relatively easy to migrate from Visual Basic.

.NET 3 and WPF

The true revolution came in 2006 when .NET 3 was released. .NET 3 had 3 new technologies that were greatly advertised:

WCF was hugely successful, and took over older technologies as it unified all types of communications, whether based on remoting, HTTP, sockets, or whatever. WF had only moderate success.

WPF was the new UI framework, and it was revolutionary. WPF ditched the Win32 UI model – a WPF “main” window still had an HWND – you can’t get away with that – but all the controls were drawn by WPF – the Win32 UI controls were not used. From Win32’s perspective there was just one HWND. Compare that to Win32 UI model, where every control is an HWND – buttons, list boxes, list views, toolbars, etc.

With the HWND restrictions gone, WPF used DirectX for rendering purposes, compared to the aging Graphics Device Interface (GDI) API used by Win32 GUIs. Without the artificial boundaries of HWNDs, WPF could do anything – combine anything – 2D, 3D, animation, media, unlimited customization – without any issues, as the entire HWND surface belonged to WPF.

I remember when I was introduced to WPF (at that time code name “Avalon”) – I was blown away. It was a far cry from the old, predictable, non-customizable model of Win32 GUIs.

WPF wasn’t just about the graphics and visuals. It also provided powerful data binding, much more powerful than the limited model supported by WinForms. I would even go so far as say it’s one of the most important of WPF’s features. WPF introduced XAML – an XML based language to declaratively build UIs, with object creation, properties, and even declarative data binding. Customizing controls could be done in several ways, including existing properties, control templates and data templates. WPF was raw power.

So, is WPF the ultimate GUI framework? It certainly looked like a prime candidate.

WPF made progress, ironing out issues, adding some features in .NET 3.5 and .NET 4. But then it seemed to have grinded to a halt. WPF barely made some minor improvements in .NET 4.5. One can say that it was pretty complete, so perhaps nothing much to add?

One aspect of WPF not dealt with well was performance. WPF could be bogged down by many control with complex data bindings – data bindings were mostly implemented with Reflection – a flexible but relatively slow .NET mechanism. There was certainly opportunities for improvement. Additionally, some controls were inherently slow, most notable the DataGrid, which was useful, but problematic as it was painfully slow. Third party libraries came in to the rescue and provided improved Data Grids of their own (most not free).

WPF had a strong following, with community created controls, and other goodies. Microsoft, however, seemed to have lost interest in WPF, the reason perhaps being the “Metro” revolution of 2012.

“Metro” and Going Universal

Windows 8 was a major release for Microsoft where UI is concerned. The “Metro” minimal language was all the rage at the time. Touch devices started to appear and Microsoft did not want to lose the battle. I noticed that Microsoft tends to move from one extreme to another, finally settling somewhere in the middle – but that usually takes years. Windows 8 is a perfect example. Metro applications (as they were called at the time) were always full screen – even on desktops with big displays. A new framework was built, based around the Windows Runtime – a new library based on the old but trusty Component Object Model (COM), with metadata used with the .NET metadata format.

The Windows Runtime UI model was built on similar principles as WPF – XAML (not the same one, mind you; that would be too easy), data binding, control templates, and other similar (but simplified) concepts from WPF. The Windows Runtime was internally built in C++, with “convenient” language projections provided out of the box for C++ (C++/CX at the time), .NET (C# and VB), and even JavaScript.

Generally, Windows 8 and the Universal applications (as they were later renamed) were pretty terrible. The “Metro design language”, with its monochromatic simplistic icons and graphics was ridiculous. Colors were gone. I felt like I’m sliding back to the 1980s when colors were limited. This “Metro” style spread everywhere as far as Microsoft is concerned. For example, Visual Studio 2012 that was out at the time was monochromatic – all icons in black only! It was a nightmare. Microsoft’s explanation was “to focus the developer attention to the code, remove distractions”. In actually, it failed miserably. I remember the control toolbox for WinForms and WPF in VS 2012 – all icons were gray – there was just no way to distinguish between them at a glance – which destroys the point of having icons in the first place. Microsoft boasted that their designers managed to make all these once colorful icons with a single color! What an achievement.

With Visual Studio 2013, they started to bring some colors back… the whole thing was so ridiculous.

The “Universal” model was created at least to address the problem of creating applications with the same code for Windows 8 and Windows Phone 8. To that end, it was successful, as the Win32 GUI was not implemented on Windows Phone, presumably because it was outdated, with lots and lots of code that is not well-suited for a small, much less powerful, form factor like the phone and other small devices.

Working with Universal applications (now called Universal Windows Platform applications) was similar to WPF to some extent, but the controls were geared towards touch devices, where fingers are mostly used. Controls were big, list views were scrolling smoothly but had very few lines of content. For desktop applications, it was a nightmare. Not to mention that Windows 7 (still very popular at the time) was not supported.

WPF was still the best option in the Microsoft space at the time, even though it stagnated. At least it worked on Windows 7, and its default control rendering was suited to desktop applications.

Windows 8.1 made some improvements in Universal apps – at least a minimize button was added! Windows 10 fixed the Universal fiasco by allowing windows to be resized normally like in the “old” days. There was a joke at the time saying that “Windows 10 returned windows to Windows. Before that it was Window – singular”.

That being said, Windows 10’s own UI was heavily influenced by Metro. The settings up use monochrome icons – how can anyone think this is better than colorful icons for easy recognition. This trend continues with Windows 11 where various classic windows are “converted” to the new “design language”. At least the settings app uses somewhat colorful icons on Windows 11.

The Universal apps could only run with a single instance, something that has since changed, but still employed. For example, the settings app in Windows 10 and 11 is single instance. Why on earth should it be in an OS named “Windows”? Give me more than one Settings window at a time!

Current State of Affairs

WPF is not moving forward. With the introduction of .NET Core (later renamed to simply .NET), WPF was open sourced, and is available in .NET 5+. It’s not cross platform, as most of the other .NET 5+ pieces.

UWP is a failure, even Microsoft admits that. It’s written in C++ (it’s based on the Windows Runtime after all), which should give it good performance not bogged down by .NET’s garbage collector and such. But its projections for C++ is awful, and in my opinion unusable. If you create a new UWP application with C++ in Visual Studio, you’ll get plenty of files, including IDL (Interface Definition Language), some generated files, and all that for a single button in a window. I tried writing something more complex, and gave up. It’s too slow and convoluted. The only real option is to use .NET – something I may not want to do with all its dependencies and overhead.

Regardless, the controls default look and feel is geared towards touch devices. I don’t care about the little animations – I want to be able to use a proper list view. For example, the Windows 11 new Task Manager that is built with the new WinUI technology (described next) uses the Win32 classic list view – because it’s fast and appropriate for this kind of tool. The rest is WinUI – the tabs are gone, there are monochromatic icons – it’s just ridiculous. The WinUI adds nothing except a dark theme option.

Task manager in Windows 11

The WinUI technology is similar to UWP in concept and implementation. The current state of UI affairs is messy – there is WinUI, UWP, .NET Maui (to replace Xamarin for mobile devices but not just) – what are people supposed to use?

All these UI libraries don’t really cater for desktop apps. This is why I’m still using WTL (which is wrapping the Win32 classic GUI API). There is no good alternative from Microsoft.

But perhaps not all is lost – Avalonia is a fairly new library attempting to bring WPF style UI and capabilities to more than just Windows. But it’s not a Microsoft library, but built by people in the community as open source – there is no telling if at some point it will stop being supported. On the other hand, WPF – a Microsoft library – stopped being supported.

Other Libraries

At this point you may be wondering why use a Microsoft library at all for desktop GUI – Microsoft has dropped the ball, as they continue to make a mess. Maybe use Blazor on the desktop? Out of scope for this post.

There are other options. many GUI libraries that use C or C++ exist – wxWidgets, GTK, and Qt, to name a few. wxWidgets supports Windows fairly well. Installing GTK successfully is a nightmare. Qt is very powerful and takes control of drawing everything, similar to the WPF model. It has powerful tools for designing GUIs, with its own declarative language based on JavaScript. With Qt you also have to use its own classes for non-UI stuff, like strings and lists. It’s also pricey for closed source.

Another alternative which has a lot of promise (some of which is already delivered) is Dear ImGui. This library is different from most others, as it’s Immediate Mode GUI, rather than Retained Mode which most other are. It’s cross platform, very flexible and fast. Just look at some of the GUIs built with it – truly impressive.

I’ll probably migrate to using ImGui. Is it the ultimate GUI framework? Not yet, but I feel it’s the closest to attain that goal. A couple of years back I implemented a mini-Process Explorer like tool with ImGui. Its list view is flexible and rich, and the library in general gets better all the time. It has great support from the authors and the community. It’s not perfect yet, there are still rough edges, and in some cases you have to work harder because of its cross-platform nature.

I should also mention Uno Platform, another cross-platform UI framework built on top of .NET, that made great strides in recent years.

What’s Next?

Microsoft has dropped the ball on desktop apps. The Win32 classic model is not being maintained. Just try to create a “dark mode” UI. I did that to some extent for the Sysinternals tools at the time. It was hard. Some things I just couldn’t do right – the scrollbars that are attached to list views and tree views, for example.

Prior to common controls version 6 (Vista), Microsoft had a “flat scroll bars” feature that allowed customization of scrollbars fairly easily (colors, for example). But surprisingly, common controls version 6 dropped this feature! Flat scroll bars are no longer supported. I had to go through hoops to implement dark scroll bars for Sysinternals – and even that was imperfect.

In my own tools, I created a theme engine as well – implemented differently – and I decided to forgo customizing scroll bars. Let them remain as is – it’s just too difficult and fragile.

I do hope Microsoft changes something in the way they look at desktop apps. This is where most Windows users are! Give us WPF in C++. Or enhance the Win32 model. The current UI mess is not helping, either.

I’m going to set some time to work on building some tools that use Dear ImGui – I feel it has the most bang for the buck.

Memory Information in Task Manager

You may have been asked this question many times: “How much memory does this process consume?” The question seems innocent enough. Your first instinct might be to open Task Manager, go to the Processes tab, find the process in the list, and look at the column marked “Memory“. What could be simpler?

A complication is hinted at when looking in the Details tab. The default memory-related column is named “Memory (Active Private Working Set)”, which seems more complex than simply “Memory”. Opening the list of columns from the Details tab shows more columns where the term “Memory” is used. What gives?

The Processes’ tab Memory column is the same as the Details’ tab Memory (active private working set). But what does it mean? Let’s break it down:

  • Working set – the memory is accessible by the processor with no page fault exception. Simply put, the memory is in RAM (physical memory).
  • Private – the memory is private to the process. This is in contrast to shared memory, which is (at least can be) shared with other processes. The canonical example of shared memory is PE images – DLLs and executables. A DLL that is mapped to multiple processes will (in most cases) have a single presence in physical memory.
  • Active – this is an artificial term used by Task Manager related to UWP (Universal Windows Platform) processes. If a UWP process’ window is minimized, this column shows zero memory consumption, because in theory, since all the process’ threads are suspended, that memory can be repurposed for other processes to use. You can try it by running Calculator, and minimizing its window. You’ll see this column showing zero. Restore the window, and it will show some non-zero value. In fact, there is a column named Memory (private working set), which shows the same thing but does not take into consideration the “active” aspect of UWP processes.

So what does all this mean? The fact that this column shows only private memory is a good thing. That’s because the shared memory size (in most cases) is not controllable and is fixed – for example, the size of a DLL – it’s out of our control – the process just needs to use the DLL. The downside of this active private working set column is that fact it only shows memory current part of the process working set – in RAM. A process may allocate a large junk of memory, but most of it may not be in RAM right now, but it is still consumed, and counts towards the commit limit of the system.

Here is a simple example. I’m writing the following code to allocate (commit) 64 GM of memory:

auto ptr = VirtualAlloc(nullptr, 64LL << 30, MEM_COMMIT | MEM_RESERVE, PAGE_READWRITE);

Here is what Task manager shows in its Performance/Memory tab before the call:

“In Use” indicates current RAM (physical memory) usage – it’s 34.6 GB. The “Committed” part is more important – it indicates how much memory I can totally commit on the system, regardless of whether it’s in physical memory now or not. It shows “44/128 GB” – 44 GB are committed now (34.6 of that in RAM), and my commit limit is 128 GB (it’s the sum of my total RAM and the configured page files sizes). Here is the same view after I commit the above 64 GB:

Notice the physical memory didn’t change much, but the committed memory “jumped” by 64 GB, meaning there is now only 20 GB left for other processes to use before the system runs out of memory (or page file expansion occurs). Looking at the Details that for this Test process shows the active private working set column indicating a very low memory consumption because it’s looking at private RAM usage only:

Only when the process starts “touching” (using) the committed memory, physical pages will start being used by the process. The name “committed” indicates the commitment of the system to providing that entire memory block if required no matter what.

Where is that 64 GB shown? The column to use is called in Task Manager Commit Size, which is in fact private committed memory:

Commit Size is the correct column to look at when trying to ascertain memory consumption in processes. The sad thing is that it’s not the default column shown, and that’s why many people use the misleading active private working set column. My guess is the reason the misleading column is shown by default is because physical memory is easy to understand for most people, whereas virtual memory – (some of which is in RAM and some which is not) is not trivially understood.

Compare Commit Size to active private working set sometimes reveals a big difference – an indication that most of the private memory of a process is not in RAM right now, but the memory is still consumed as far as the memory manager is concerned.

A related confusion exists because of different terminology used by different tools. Specifically, Commit Size in Task Manager is called Private Bytes in Process Explorer and Performance Monitor.

Task Manager’s other memory columns allow you to look at more memory counters such as Working Set (total RAM used by a process, including private and shared memory), Peak Working Set, Memory (shared working set), and Working Set Delta.

There are other subtleties I am not expanding on in this post. Hopefully, I’ll touch on these in a future post.

Bottom line: Commit Size is the way to go.

Minimal Executables

Here is a simple experiment to try: open Visual Studio and create a C++ console application. All that app is doing is display “hello world” to the console:

#include <stdio.h>

int main() {
	printf("Hello, world!\n");
	return 0;
}

Build the executable in Release build and check its size. I get 11KB (x64). Not too bad, perhaps. However, if we check the dependencies of this executable (using the dumpbin command line tool or any PE Viewer), we’ll find the following in the Import directory:

There are two dependencies: Kernel32.dll and VCRuntime140.dll. This means these DLLs will load at process start time no matter what. If any of these DLLs is not found, the process will crash. We can’t get rid of Kernel32 easily, but we may be able to link statically to the CRT. Here is the required change to VS project properties:

After building, the resulting executable jumps to 136KB in size! Remember, it’s a “hello, world” application. The Imports directory in a PE viewer now show Kernel32.dll as the only dependency.

Is that best we can do? Why do we need the CRT in the first place? One obvious reason is the usage of the printf function, which is implemented by the CRT. Maybe we can use something else without depending on the CRT. There are other reasons the CRT is needed. Here are a few:

  • The CRT is the one calling our main function with the correct argc and argv. This is expected behavior by developers.
  • Any C++ global objects that have constructors are executed by the CRT before the main function is invoked.
  • Other expected behaviors are provided by the CRT, such as correct handling of the errno (global) variable, which is not really global, but uses Thread-Local-Storage behind the scenes to make it per-thread.
  • The CRT implements the new and delete C++ operators, without which much of the C++ standard library wouldn’t work without major customization.

Still, we may be OK doing things outside the CRT, taking care of ourselves. Let’s see if we can pull it off. Let’s tell the linker that we’re not interested in the CRT:

Setting “Ignore All Default Libraries” tells the linker we’re not interested in linking with the CRT in any way. Building the app now gives some linker errors:

1>Test2.obj : error LNK2001: unresolved external symbol __security_check_cookie
1>Test2.obj : error LNK2001: unresolved external symbol __imp___acrt_iob_func
1>Test2.obj : error LNK2001: unresolved external symbol __imp___stdio_common_vfprintf
1>LINK : error LNK2001: unresolved external symbol mainCRTStartup
1>D:\Dev\Minimal\x64\Release\Test2.exe : fatal error LNK1120: 4 unresolved externals

One thing we expected is the missing printf implementation. What about the other errors? We have the missing “security cookie” implementation, which is a feature of the CRT to try to detect stack overrun by placing a “cookie” – some number – before making certain function calls and making sure that cookie is still there after returning. We’ll have to settle without this feature. The main missing piece is mainCRTStartup, which is the default entry point that the linker is expecting. We can change the name, or overwrite main to have that name.

First, let’s try to fix the linker errors before reimplementing the printf functionality. We’ll remove the printf call and rebuild. Things are improving:

>Test2.obj : error LNK2001: unresolved external symbol __security_check_cookie
1>LINK : error LNK2001: unresolved external symbol mainCRTStartup
1>D:\Dev\Minimal\x64\Release\Test2.exe : fatal error LNK1120: 2 unresolved externals

The “security cookie” feature can be removed with another compiler option:

When rebuilding, we get a warning about the “/sdl” (Security Developer Lifecycle) option conflicting with removing the security cookie, which we can remove as well. Regardless, the final linker error remains – mainCRTStartup.

We can rename main to mainCRTStartup and “implement” printf by going straight to the console API (part of Kernel32.Dll):

#include <Windows.h>

int mainCRTStartup() {
	char text[] = "Hello, World!\n";
	::WriteConsoleA(::GetStdHandle(STD_OUTPUT_HANDLE),
		text, (DWORD)strlen(text), nullptr, nullptr);

	return 0;
}

This compiles and links ok, and we get the expected output. The file size is only 4KB! An improvement even over the initial project. The dependencies are still just Kernel32.DLL, with the only two functions used:

You may be thinking that although we replaced printf, that’s wasn’t the full power of printf – it supports various format specifiers, etc., which are going to be difficult to reimplement. Is this just a futile exercise?

Not necessarily. Remember that every user mode process always links with NTDLL.dll, which means the API in NtDll is always available. As it turns out, a lot of functionality that is implemented by the CRT is also implemented in NTDLL. printf is not there, but the next best thing is – sprintf and the other similar formatting functions. They would fill a buffer with the result, and then we could call WriteConsole to spit it to the console. Problem solved!

Removing the CRT

Well, almost. Let’s add a definition for sprintf_s (we’ll be nice and go with the “safe” version), and then use it:

#include <Windows.h>

extern "C" int __cdecl sprintf_s(
	char* buffer,
	size_t sizeOfBuffer,
	const char* format,	...);

int mainCRTStartup() {
	char text[64];
	sprintf_s(text, _countof(text), "Hello, world from process %u\n", ::GetCurrentProcessId());
	::WriteConsoleA(::GetStdHandle(STD_OUTPUT_HANDLE),
		text, (DWORD)strlen(text), nullptr, nullptr);

	return 0;
}

Unfortunately, this does not link: sprintf_s is an unresolved external, just like strlen. It makes sense, since the linker does not know where to look for it. Let’s help out by adding the import library for NtDll:

#pragma comment(lib, "ntdll")

This should work, but one error persists – sprintf_s; strlen however, is resolved. The reason is that the import library for NtDll provided by Microsoft does not have an import entry for sprintf_s and other CRT-like functions. Why? No good reason I can think of. What can we do? One option is to create an NtDll.lib import library of our own and use it. In fact, some people have already done that. One such file can be found as part of my NativeApps repository (it’s called NtDll64.lib, as the name does not really matter). The other option is to link dynamically. Let’s do that:

int __cdecl sprintf_s_f(
	char* buffer, size_t sizeOfBuffer, const char* format, ...);

int mainCRTStartup() {
	auto sprintf_s = (decltype(sprintf_s_f)*)::GetProcAddress(
        ::GetModuleHandle(L"ntdll"), "sprintf_s");
	if (sprintf_s) {
		char text[64];
		sprintf_s(text, _countof(text), "Hello, world from process %u\n", ::GetCurrentProcessId());
		::WriteConsoleA(::GetStdHandle(STD_OUTPUT_HANDLE),
			text, (DWORD)strlen(text), nullptr, nullptr);
	}

	return 0;
}

Now it works and runs as expected.

You may be wondering why does NTDLL implement the CRT-like functions in the first place? The CRT exists, after all, and can be normally used. “Normally” is the operative word here. Native applications, those that can only depend on NTDLL cannot use the CRT. And this is why these functions are implemented as part of NTDLL – to make it easier to build native applications. Normally, native applications are built by Microsoft only. Examples include Smss.exe (the session manager), CSrss.exe (the Windows subsystem process), and UserInit.exe (normally executed by WinLogon.exe on a successful login).

One thing that may be missing in our “main” function are command line arguments. Can we just add the classic argc and argv and go about our business? Let’s try:

int mainCRTStartup(int argc, const char* argv[]) {
//...
char text[64];
sprintf_s(text, _countof(text), 
    "argc: %d argv[0]: 0x%p\n", argc, argv[0]);
::WriteConsoleA(::GetStdHandle(STD_OUTPUT_HANDLE),
	text, (DWORD)strlen(text), nullptr, nullptr);

Seems simple enough. argv[0] should be the address of the executable path itself. The code carefully displays the address only, not trying to dereference it as a string. The result, however, is perplexing:

argc: -359940096 argv[0]: 0x74894808245C8948

This seems completely wrong. The reason we see these weird values (if you try it, you’ll get different values. In fact, you may get different values in every run!) is that the expected parameters by a true entry point of an executable is not based on argc and argv – this is part of the CRT magic. We don’t have a CRT anymore. There is in fact just one argument, and it’s the Process Environment Block (PEB). We can add some code to show some of what is in there (non-relevant code omitted):

#include <Windows.h>
#include <winternl.h>
//...
int mainCRTStartup(PPEB peb) {
	char text[256];
	sprintf_s(text, _countof(text), "PEB: 0x%p\n", peb);
	::WriteConsoleA(::GetStdHandle(STD_OUTPUT_HANDLE),
		text, (DWORD)strlen(text), nullptr, nullptr);

	sprintf_s(text, _countof(text), "Executable: %wZ\n", 
        peb->ProcessParameters->ImagePathName);
	::WriteConsoleA(::GetStdHandle(STD_OUTPUT_HANDLE),
		text, (DWORD)strlen(text), nullptr, nullptr);

	sprintf_s(text, _countof(text), "Commandline: %wZ\n", 
        peb->ProcessParameters->CommandLine);
	::WriteConsoleA(::GetStdHandle(STD_OUTPUT_HANDLE),
		text, (DWORD)strlen(text), nullptr, nullptr);

<Winternl.h> contains some NTDLL definitions, such as a partially defined PEB. In it, there is a ProcessParameters member that holds the image path and the full command line. Here is the result on my console:

PEB: 0x000000EAC01DB000
Executable: D:\Dev\Minimal\x64\Release\Test3.exe
Commandline: "D:\Dev\Minimal\x64\Release\Test3.exe"

The PEB is the argument provided by the OS to the entry point, whatever its name is. This is exactly what native applications get as well. By the way, we could have used GetCommandLine from Kernel32.dll to get the command line if we didn’t add the PEB argument. But for native applications (that can only depend on NTDLL), GetCommandLine is not an option.

Going Native

How far are we from a true native application? What would be the motivation for such an application anyway, besides small file size and reduced dependencies? Let’s start with the first question.

To make our executable truly native, we have to do two things. The first is to change the subsystem of the executable (stored in the PE header) to Native. VS provides this option via a linker setting:

The second thing is to remove the dependency on Kernel32.Dll. No more WriteConsole and no GetCurrentProcessId. We will have to find some equivalent in NTDLL, or write our own implementation leveraging what NtDll has to offer. This is obviously not easy, given that most of NTDLL is undocumented, but most function prototypes are available as part of the Process Hacker/phnt project.

For the second question – why bother? Well, one reason is that native applications can be configured to run very early in Windows boot – these in fact run by Smss.exe itself when it’s the only existing user-mode process at that time. Such applications (like autochk.exe, a native chkdsk.exe) must be native – they cannot depend on the CRT or even on kernel32.dll, since the Windows Subsystem Process (csrss.exe) has not been launched yet.

For more information on Native Applications, you can view my talk on the subject.

I may write a blog post on native application to give more details. The examples shown here can be found here.

Happy minimization!

Levels of Kernel Debugging

Doing any kind of research into the Windows kernel requires working with a kernel debugger, mostly WinDbg (or WinDbg Preview). There are at least 3 “levels” of debugging the kernel.

Level 1: Local Kernel Debugging

The first is using a local kernel debugger, which means configuring WinDbg to look at the kernel of the local machine. This can be configured by running the following command in an elevated command window, and restarting the system:

bcdedit -debug on

You must disable Secure Boot (if enabled) for this command to work, as Secure Boot protects against putting the machine in local kernel debugging mode. Once the system is restarted, WinDbg launched elevated, select File/Kernel Debug and go with the “Local” option (WinDbg Preview shown):

If all goes well, you’ll see the “lkd>” prompt appearing, confirming you’re in local kernel debugging mode.

What can you in this mode? You can look at anything in kernel and user space, such as listing the currently existing processes (!process 0 0), or examining any memory location in kernel or user space. You can even change kernel memory if you so desire, but be careful, any “bad” change may crash your system.

The downside of local kernel debugging is that the system is a moving target, things change while you’re typing commands, so you don’t want to look at things that change quickly. Additionally, you cannot set any breakpoint; you cannot view any CPU registers, since these are changing constantly, and are on a CPU-basis anyway.

The upside of local kernel debugging is convenience – setting it up is very easy, and you can still get a lot of information with this mode.

Level 2: Remote Debugging of a Virtual Machine

The next level is a full kernel debugging experience of a virtual machine, which can be running locally on your host machine, or perhaps on another host somewhere. Setting this up is more involved. First, the target VM must be set up to allow kernel debugging and set the “interface” to the host debugger. Windows supports several interfaces, but for a VM the best to use is network (supported on Windows 8 and later).

First, go to the VM and ping the host to find out its IP address. Then type the following:

bcdedit /dbgsettings net hostip:172.17.32.1 port:55000 key:1.2.3.4

Replace the host IP with the correct address, and select an unused port on the host. The key can be left out, in which case the command will generate something for you. Since that key is needed on the host side, it’s easier to select something simple. If the target VM is not local, you might prefer to let the command generate a random key and use that.

Next, launch WinDbg elevated on the host, and attach to the kernel using the “Net” option, specifying the correct port and key:

Restart the target, and it should connect early in its boot process:

Microsoft (R) Windows Debugger Version 10.0.25200.1003 AMD64
Copyright (c) Microsoft Corporation. All rights reserved.

Using NET for debugging
Opened WinSock 2.0
Waiting to reconnect...
Connected to target 172.29.184.23 on port 55000 on local IP 172.29.176.1.
You can get the target MAC address by running .kdtargetmac command.
Connected to Windows 10 25309 x64 target at (Tue Mar  7 11:38:18.626 2023 (UTC - 5:00)), ptr64 TRUE
Kernel Debugger connection established.  (Initial Breakpoint requested)

************* Path validation summary **************
Response                         Time (ms)     Location
Deferred                                       SRV*d:\Symbols*https://msdl.microsoft.com/download/symbols
Symbol search path is: SRV*d:\Symbols*https://msdl.microsoft.com/download/symbols
Executable search path is: 
Windows 10 Kernel Version 25309 MP (1 procs) Free x64
Edition build lab: 25309.1000.amd64fre.rs_prerelease.230224-1334
Machine Name:
Kernel base = 0xfffff801`38600000 PsLoadedModuleList = 0xfffff801`39413d70
System Uptime: 0 days 0:00:00.382
nt!DebugService2+0x5:
fffff801`38a18655 cc              int     3

Enter the g command to let the system continue. The prompt is “kd>” with the current CPU number on the left. You can break at any point into the target by clicking the “Break” toolbar button in the debugger. Then you can set up breakpoints, for whatever you’re researching. For example:

1: kd> bp nt!ntWriteFile
1: kd> g
Breakpoint 0 hit
nt!NtWriteFile:
fffff801`38dccf60 4c8bdc          mov     r11,rsp
2: kd> k
 # Child-SP          RetAddr               Call Site
00 fffffa03`baa17428 fffff801`38a81b05     nt!NtWriteFile
01 fffffa03`baa17430 00007ff9`1184f994     nt!KiSystemServiceCopyEnd+0x25
02 00000095`c2a7f668 00007ff9`0ec89268     0x00007ff9`1184f994
03 00000095`c2a7f670 0000024b`ffffffff     0x00007ff9`0ec89268
04 00000095`c2a7f678 00000095`c2a7f680     0x0000024b`ffffffff
05 00000095`c2a7f680 0000024b`00000001     0x00000095`c2a7f680
06 00000095`c2a7f688 00000000`000001a8     0x0000024b`00000001
07 00000095`c2a7f690 00000095`c2a7f738     0x1a8
08 00000095`c2a7f698 0000024b`af215dc0     0x00000095`c2a7f738
09 00000095`c2a7f6a0 0000024b`0000002c     0x0000024b`af215dc0
0a 00000095`c2a7f6a8 00000095`c2a7f700     0x0000024b`0000002c
0b 00000095`c2a7f6b0 00000000`00000000     0x00000095`c2a7f700
2: kd> .reload /user
Loading User Symbols
.....................
2: kd> k
 # Child-SP          RetAddr               Call Site
00 fffffa03`baa17428 fffff801`38a81b05     nt!NtWriteFile
01 fffffa03`baa17430 00007ff9`1184f994     nt!KiSystemServiceCopyEnd+0x25
02 00000095`c2a7f668 00007ff9`0ec89268     ntdll!NtWriteFile+0x14
03 00000095`c2a7f670 00007ff9`08458dda     KERNELBASE!WriteFile+0x108
04 00000095`c2a7f6e0 00007ff9`084591e6     icsvc!ICTransport::PerformIoOperation+0x13e
05 00000095`c2a7f7b0 00007ff9`08457848     icsvc!ICTransport::Write+0x26
06 00000095`c2a7f800 00007ff9`08452ea3     icsvc!ICEndpoint::MsgTransactRespond+0x1f8
07 00000095`c2a7f8b0 00007ff9`08452abc     icsvc!ICTimeSyncReferenceMsgHandler+0x3cb
08 00000095`c2a7faf0 00007ff9`084572cf     icsvc!ICTimeSyncMsgHandler+0x3c
09 00000095`c2a7fb20 00007ff9`08457044     icsvc!ICEndpoint::HandleMsg+0x11b
0a 00000095`c2a7fbb0 00007ff9`084574c1     icsvc!ICEndpoint::DispatchBuffer+0x174
0b 00000095`c2a7fc60 00007ff9`08457149     icsvc!ICEndpoint::MsgDispatch+0x91
0c 00000095`c2a7fcd0 00007ff9`0f0344eb     icsvc!ICEndpoint::DispatchThreadFunc+0x9
0d 00000095`c2a7fd00 00007ff9`0f54292d     ucrtbase!thread_start<unsigned int (__cdecl*)(void *),1>+0x3b
0e 00000095`c2a7fd30 00007ff9`117fef48     KERNEL32!BaseThreadInitThunk+0x1d
0f 00000095`c2a7fd60 00000000`00000000     ntdll!RtlUserThreadStart+0x28
2: kd> !process -1 0
PROCESS ffffc706a12df080
    SessionId: 0  Cid: 0828    Peb: 95c27a1000  ParentCid: 044c
    DirBase: 1c57f1000  ObjectTable: ffffa50dfb92c880  HandleCount: 123.
    Image: svchost.exe

In this “level” of debugging you have full control of the system. When in a breakpoint, nothing is moving. You can view register values, call stacks, etc., without anything changing “under your feet”. This seems perfect, so do we really need another level?

Some aspects of a typical kernel might not show up when debugging a VM. For example, looking at the list of interrupt service routines (ISRs) with the !idt command on my Hyper-V VM shows something like the following (truncated):

2: kd> !idt

Dumping IDT: ffffdd8179e5f000

00:	fffff80138a79800 nt!KiDivideErrorFault
01:	fffff80138a79b40 nt!KiDebugTrapOrFault	Stack = 0xFFFFDD8179E95000
02:	fffff80138a7a140 nt!KiNmiInterrupt	Stack = 0xFFFFDD8179E8D000
03:	fffff80138a7a6c0 nt!KiBreakpointTrap
...
2e:	fffff80138a80e40 nt!KiSystemService
2f:	fffff80138a75750 nt!KiDpcInterrupt
30:	fffff80138a733c0 nt!KiHvInterrupt
31:	fffff80138a73720 nt!KiVmbusInterrupt0
32:	fffff80138a73a80 nt!KiVmbusInterrupt1
33:	fffff80138a73de0 nt!KiVmbusInterrupt2
34:	fffff80138a74140 nt!KiVmbusInterrupt3
35:	fffff80138a71d88 nt!HalpInterruptCmciService (KINTERRUPT ffffc70697f23900)

36:	fffff80138a71d90 nt!HalpInterruptCmciService (KINTERRUPT ffffc70697f23a20)

b0:	fffff80138a72160 ACPI!ACPIInterruptServiceRoutine (KINTERRUPT ffffdd817a1ecdc0)
...

Some things are missing, such as the keyboard interrupt handler. This is due to certain things handled “internally” as the VM is “enlightened”, meaning it “knows” it’s a VM. Normally, it’s a good thing – you get nice support for copy/paste between the VM and the host, seamless mouse and keyboard interaction, etc. But it does mean it’s not the same as another physical machine.

Level 3: Remote debugging of a physical machine

In this final level, you’re debugging a physical machine, which provides the most “authentic” experience. Setting this up is the trickiest. Full description of how to set it up is described in the debugger documentation. In general, it’s similar to the previous case, but network debugging might not work for you depending on the network card type your target and host machines have.

If network debugging is not supported because of the limited list of network cards supported, your best bet is USB debugging using a dedicated USB cable that you must purchase. The instructions to set up USB debugging are provided in the docs, but it may require some trial and error to locate the USB ports that support debugging (not all do). Once you have that set up, you’ll use the “USB” tab in the kernel attachment dialog on the host. Once connected, you can set breakpoints in ISRs that may not exist on a VM:

: kd> !idt

Dumping IDT: fffff8022f5b1000

00:	fffff80233236100 nt!KiDivideErrorFault
...
80:	fffff8023322cd70 i8042prt!I8042KeyboardInterruptService (KINTERRUPT ffffd102109c0500)
...
Dumping Secondary IDT: ffffe5815fa0e000 

01b0:hidi2c!OnInterruptIsr (KMDF) (KINTERRUPT ffffd10212e6edc0)

0: kd> bp i8042prt!I8042KeyboardInterruptService
0: kd> g
Breakpoint 0 hit
i8042prt!I8042KeyboardInterruptService:
fffff802`6dd42100 4889542410      mov     qword ptr [rsp+10h],rdx
0: kd> k
 # Child-SP          RetAddr               Call Site
00 fffff802`2f5cdf48 fffff802`331453cb     i8042prt!I8042KeyboardInterruptService
01 fffff802`2f5cdf50 fffff802`3322b25f     nt!KiCallInterruptServiceRoutine+0x16b
02 fffff802`2f5cdf90 fffff802`3322b527     nt!KiInterruptSubDispatch+0x11f
03 fffff802`2f5be9f0 fffff802`3322e13a     nt!KiInterruptDispatch+0x37
04 fffff802`2f5beb80 00000000`00000000     nt!KiIdleLoop+0x5a

Happy debugging!

Windows Kernel Programming Class Recordings

I’ve recently posted about the upcoming training classes, the first of which is Advanced Windows Kernel Programming in April. Some people have asked me how can they participate if they have not taken the Windows Kernel Programming fundamentals class, and they might not have the required time to read the book.

Since I don’t plan on providing the fundamentals training class before April, after some thought, I decided to do the following.

I am selling one of the previous Windows Kernel Programming class recordings, along with the course PDF materials, the labs, and solutions to the labs. This is the first time I’m selling recordings of my public classes. If this “experiment” goes well, I might consider doing this with other classes as well. Having recordings is not the same as doing a live training class, but it’s the next best thing if the knowledge provided is valuable and useful. It’s about 32 hours of video, and plenty of labs to keep you busy 🙂

As an added bonus, I am also giving the following to those purchasing the training class:

  • You get 10% discount for the Advanced Windows Kernel Programming class in April.
  • You will be added to a discord server that will host all the Alumni from my public classes (an idea I was given by some of my students which will happen soon)
  • A live session with me sometime in early April (I’ll do a couple in different times of day so all time zones can find a comfortable session) where you can ask questions about the class, etc.

These are the modules covered in the class recordings:

  • Module 0: Introduction
  • Module 1: Windows Internals Overview
  • Module 2: The I/O System
  • Module 3: Device Driver Basics
  • Module 4: The I/O Request Packet
  • Module 5: Kernel Mechanisms
  • Module 6: Process and Thread Monitoring
  • Module 7: Object and Registry Notifications
  • Module 8: File System Mini-Filters Fundamentals
  • Module 9: Miscellaneous Techniques

If you’re interested in purchasing the class, send me an email to zodiacon@live.com with the title “Kernel Programming class recordings” and I will reply with payment details. Once paid, reply with the payment information, and I will share a link with the course. I’m working on splitting the recordings into meaningful chunks, so not all are ready yet, but these will be completed in the next day or so.

Here are the rules after a purchase:

  • No refunds – once you have access to the recordings, this is it.
  • No sharing – the content is for your own personal viewing. No sharing of any kind is allowed.
  • No reselling – I own the copyright and all rights.

The cost is 490 USD for the entire class. That’s the whole 32 hours.

If you’re part of a company (or simply have friends) that would like to purchase multiple “licenses”, contact me for a discount.